Menafsirkan plot deret waktu
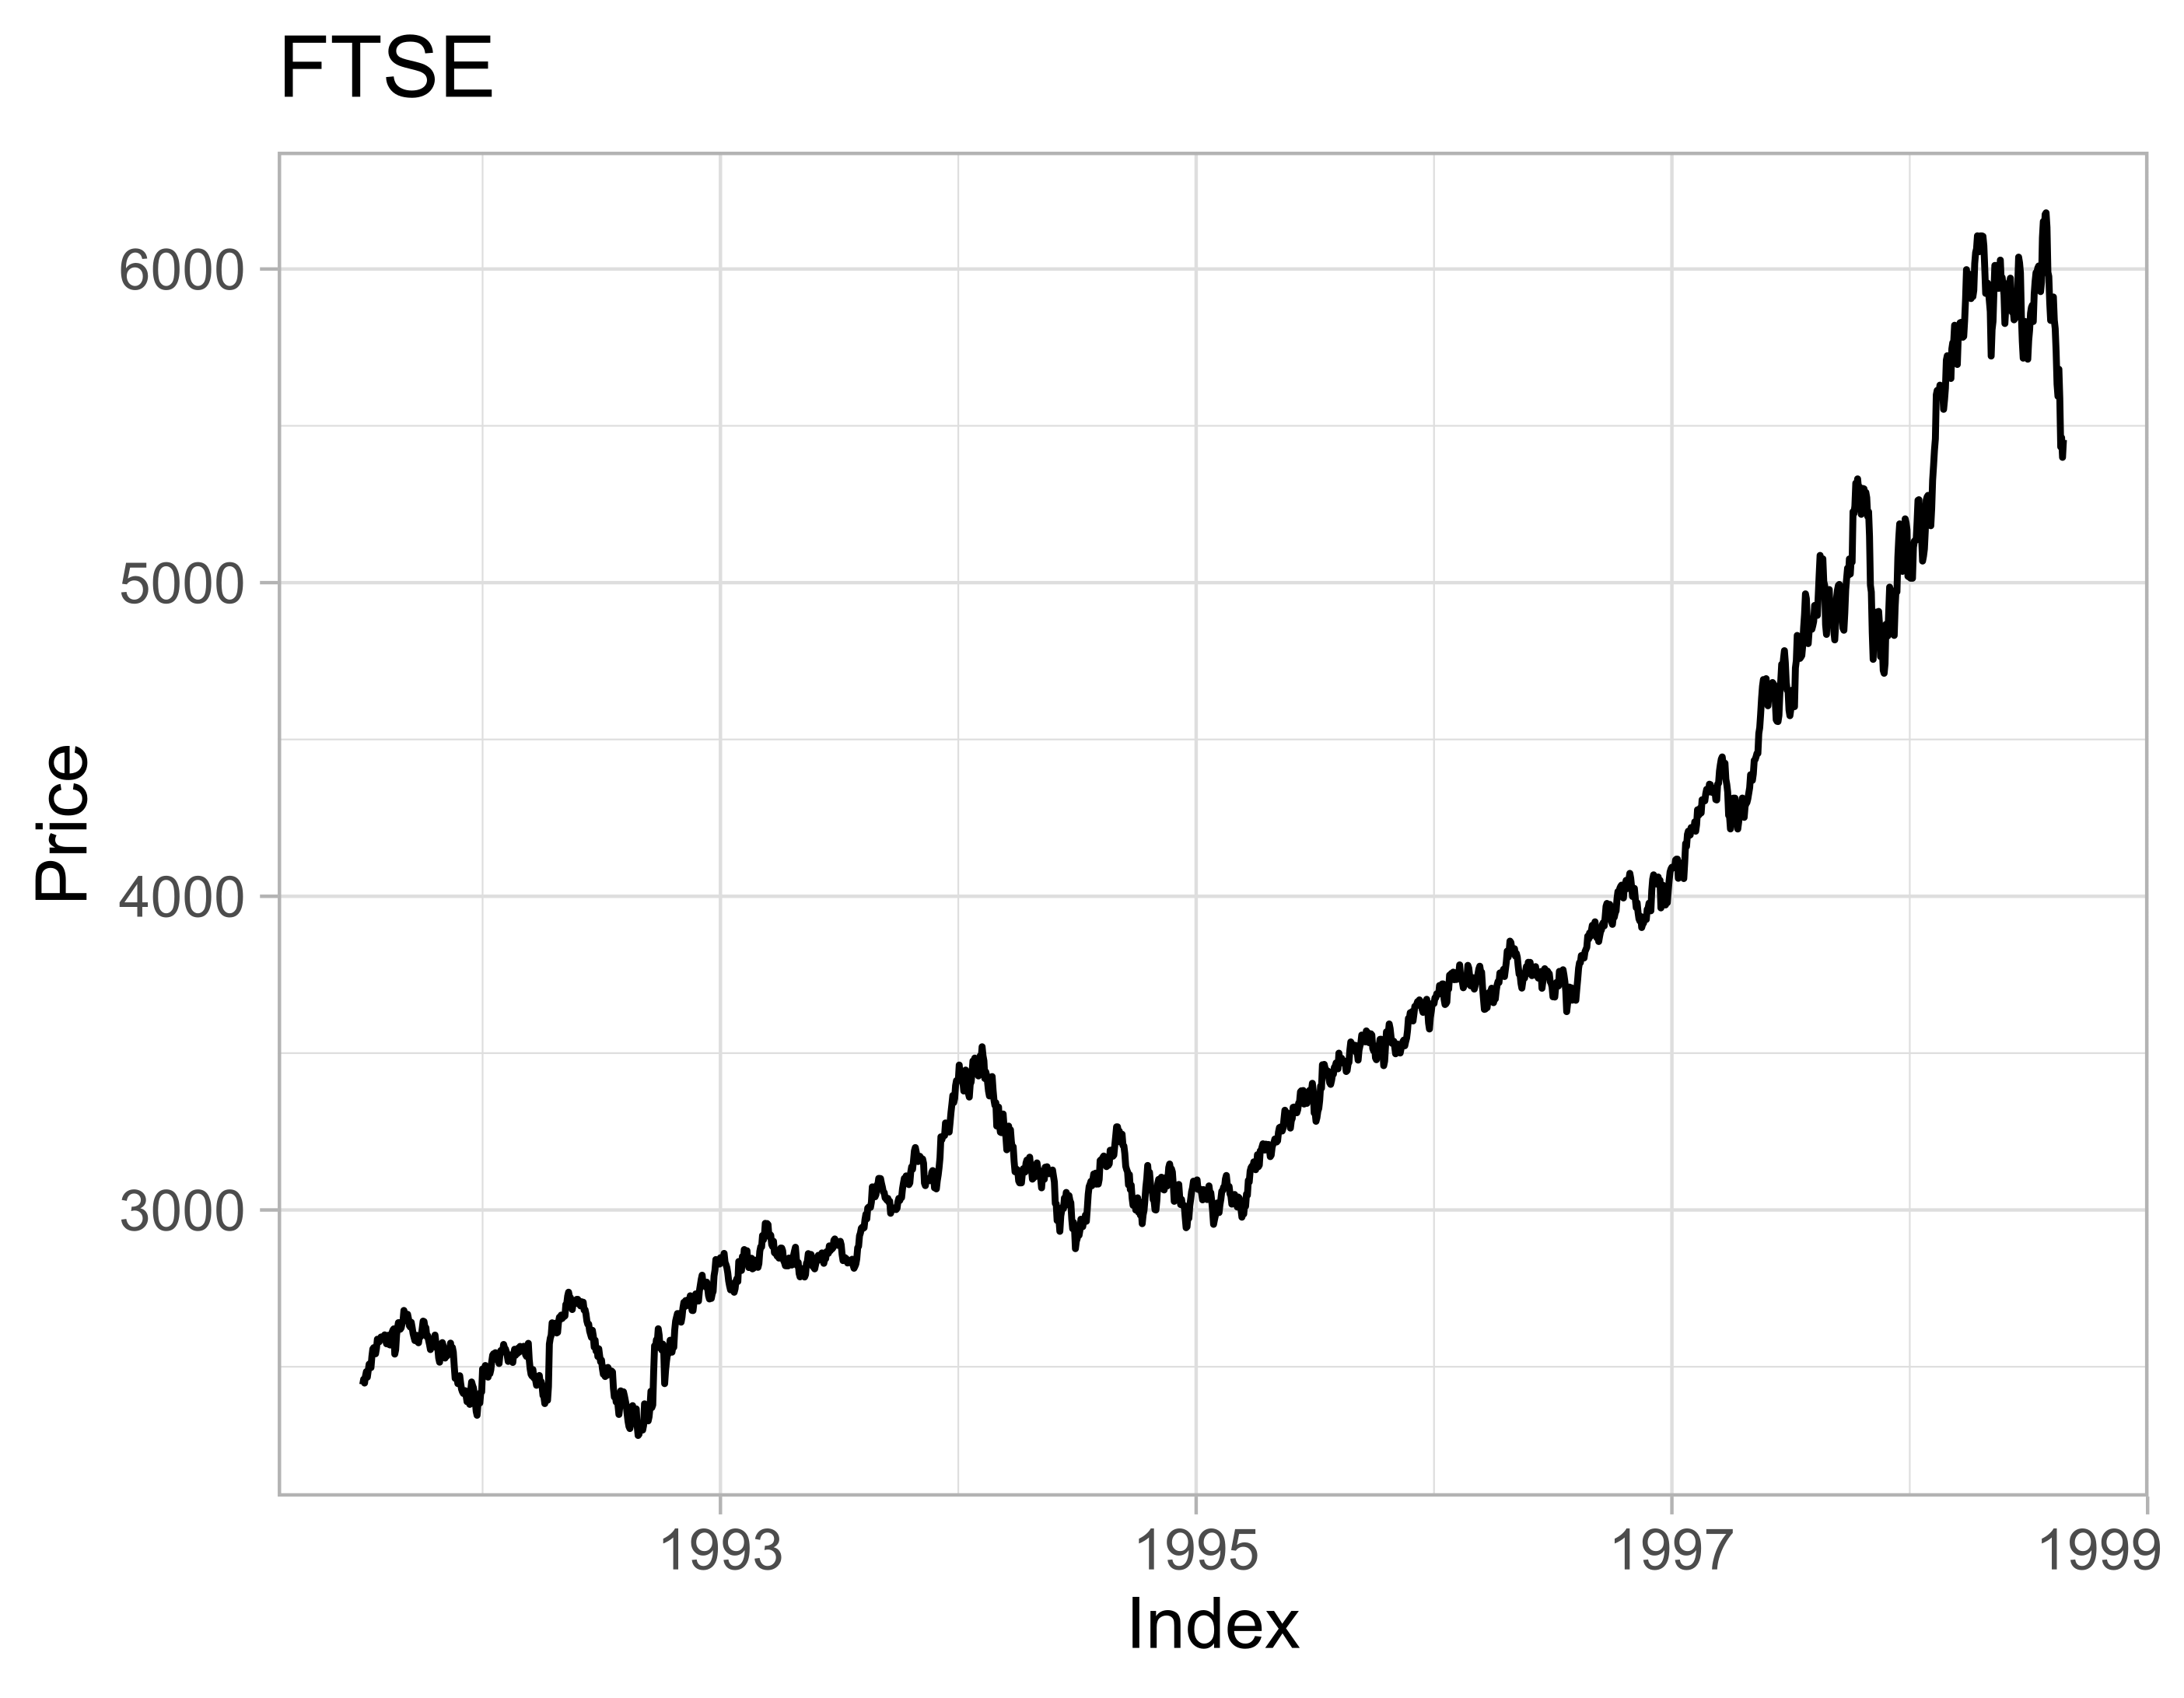
Saat memvisualisasikan data deret waktu, kemampuan menafsirkan berbagai fitur dan atribut pada plot data Anda sangatlah penting. Menentukan properti data dari sebuah plot membantu Anda menyiapkan alat yang tepat untuk analisis. Pada latihan ini, Anda akan menafsirkan beberapa properti deret waktu ftse berdasarkan plotnya.
Latihan ini merupakan bagian dari kursus
Memanipulasi Data Deret Waktu di R
Latihan interaktif langsung
Ubah teori menjadi aksi dengan salah satu latihan interaktif kami
 Mulai latihan