Identifikasi pencilan
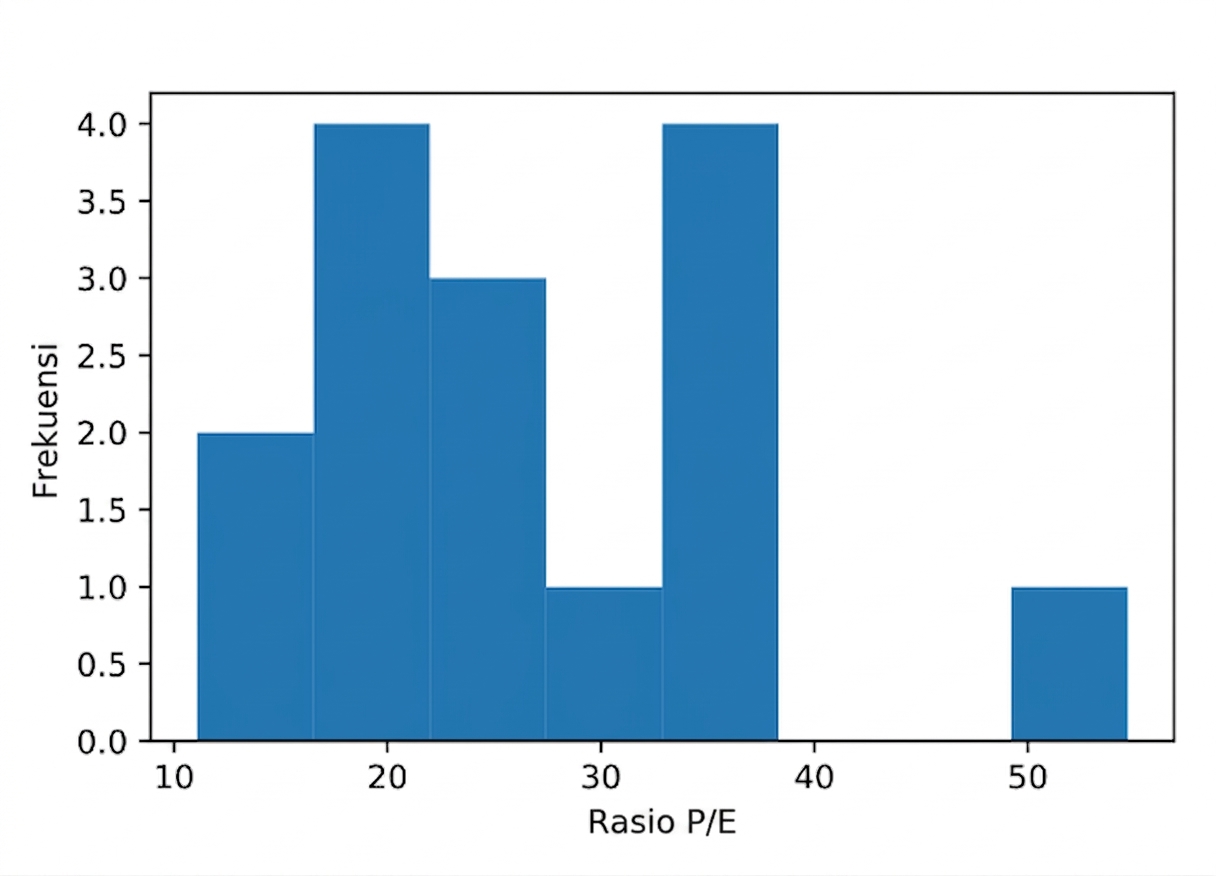
Histogram dapat membantu Anda mengidentifikasi pencilan atau titik data yang tidak normal. Rasio P/E mana pada histogram ini yang merupakan contoh pencilan?
Latihan ini merupakan bagian dari kursus
Pengantar Python untuk Keuangan
Latihan interaktif langsung
Ubah teori menjadi aksi dengan salah satu latihan interaktif kami
 Mulai latihan