Memvalidasi klaster
Pada plot di bawah ini Anda melihat hasil pengelompokan dari data susunan pemain yang sama seperti sebelumnya, tetapi dengan beberapa modifikasi kecil pada langkah pengelompokan.
- Plot kiri dibuat dengan
k=2danmethod = 'average' - Plot kanan dibuat dengan
k=3danmethod = 'complete'
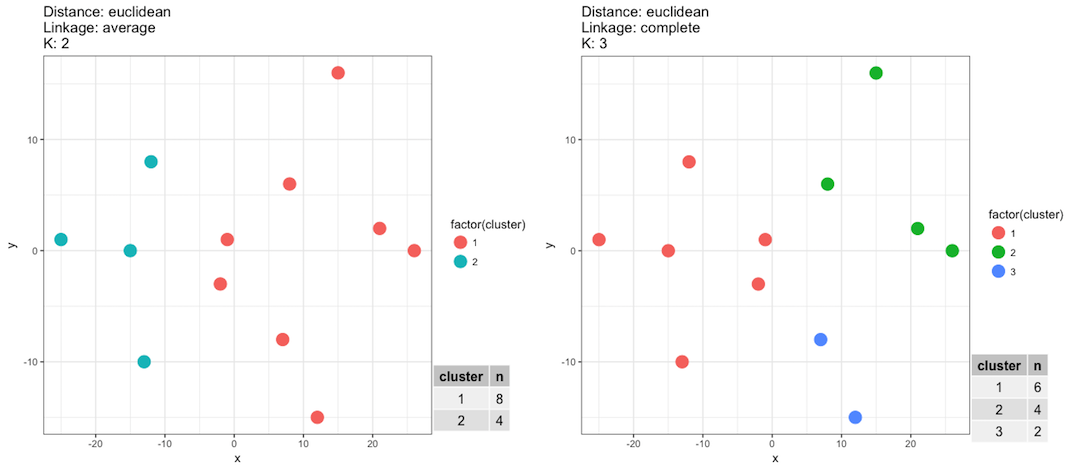
Jika tujuan kita adalah menempatkan setiap pemain ke tim yang benar, maka berdasarkan apa yang Anda lihat pada plot di atas dan apa yang Anda ketahui tentang himpunan data tersebut, pernyataan manakah di bawah ini yang benar?
Latihan ini merupakan bagian dari kursus
Analisis Klaster di R
Latihan interaktif langsung
Ubah teori menjadi aksi dengan salah satu latihan interaktif kami
 Mulai latihan