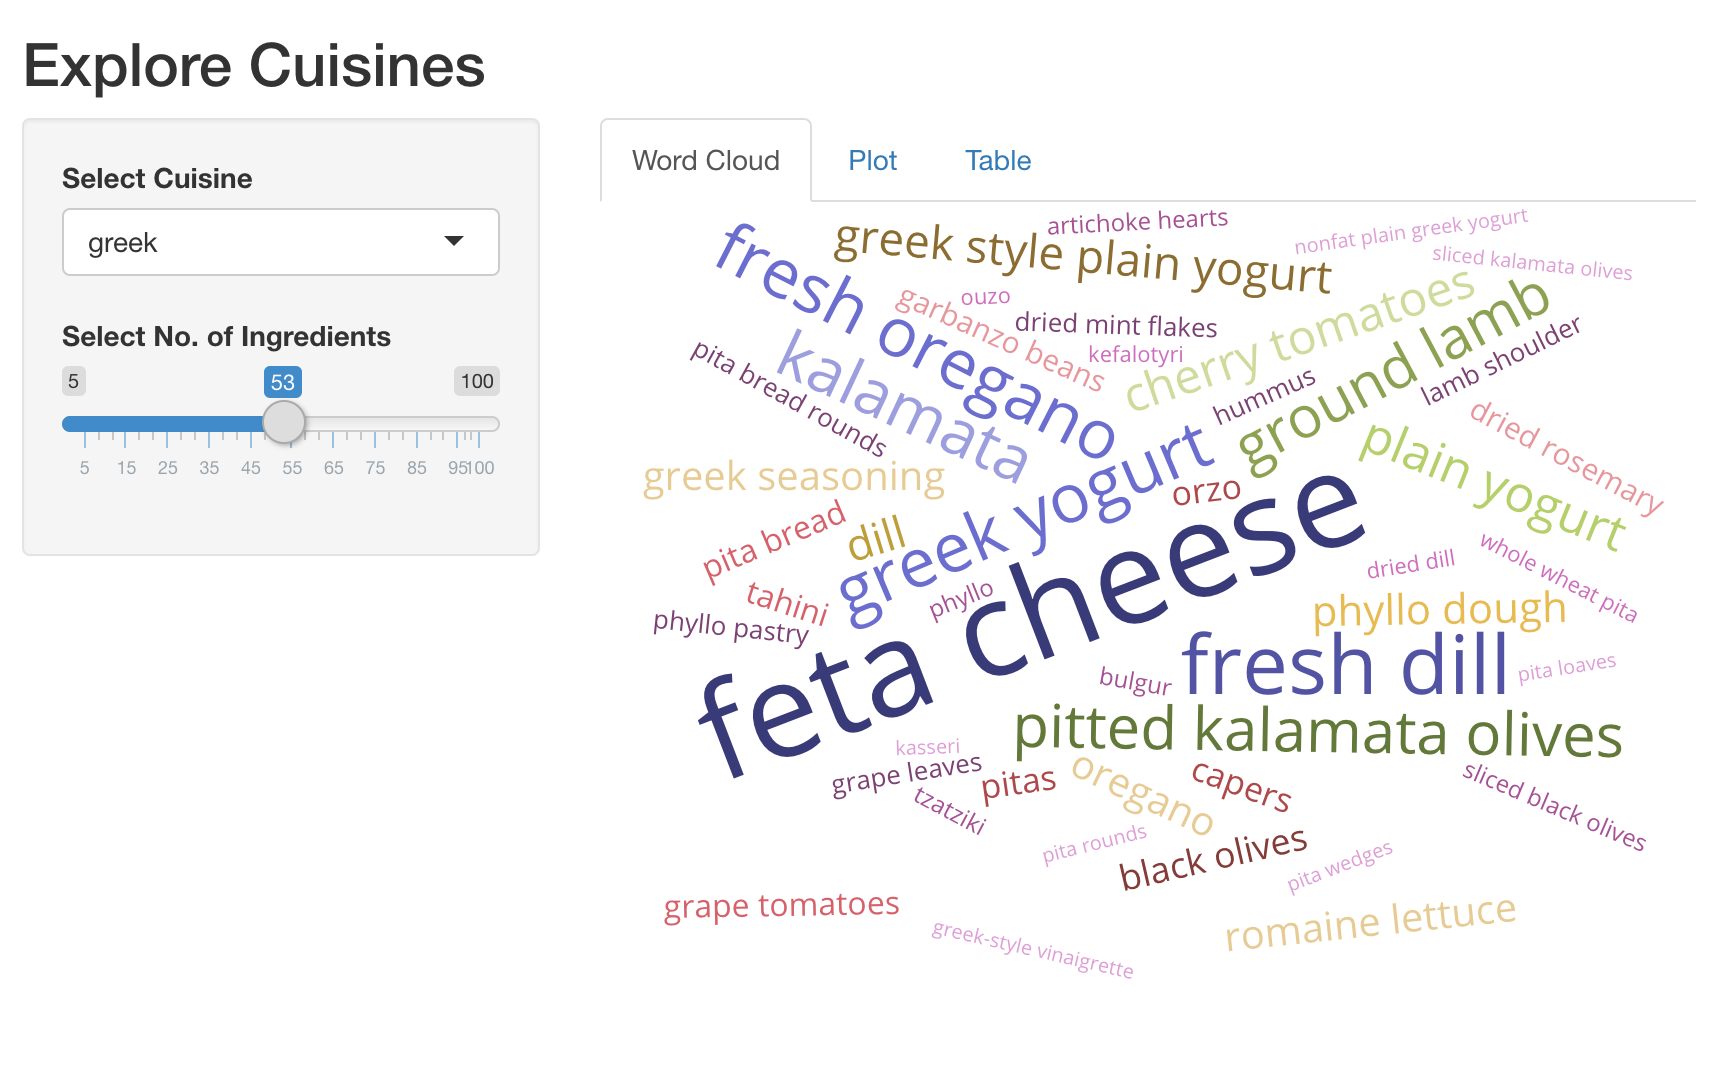
Jelajahi kuliner: wordcloud
Semoga Anda menikmati membangun aplikasi Shiny bertema makanan ini! Salah satu cara praktis untuk memvisualisasikan banyak data adalah melalui word cloud. Pada latihan ini, Anda akan memperluas aplikasi Shiny yang telah kita bangun sebelumnya dan menambahkan tab baru yang menampilkan bahan-bahan pembeda teratas sebagai word cloud interaktif.
Kami sudah memuat paket shiny, dplyr, ggplot2, plotly, dan
d3wordcloud. Berikut cuplikan praktis untuk membuat word cloud.
d3wordcloud(
  words = c('hello', 'world', 'good'),
  freqs = c(20, 40, 30),
  tooltip = TRUE
)
Latihan ini merupakan bagian dari kursus
Membangun Aplikasi Web dengan Shiny di R
Instruksi latihan
- UI: Tambahkan
d3wordcloudOutput()bernamawc_ingredients, dan bungkus dalamtabPanel(). Ini harus menjaditabPanel()pertama di aplikasi Anda. - Server: Render word cloud interaktif dari bahan-bahan teratas dan
jumlah resep tempat bahan tersebut digunakan, dengan
d3wordcloud::renderD3wordcloud()dan tetapkan ke output bernamawc_ingredients. Anda perlu menggunakan ekspresi reaktifrval_top_ingredients()untuk mengembalikan data frame berisi bahan-bahan teratas beserta jumlah resepnya.
Latihan interaktif langsung praktik
Cobalah latihan ini dengan melengkapi kode contoh ini.
ui <- fluidPage(
  titlePanel('Explore Cuisines'),
  sidebarLayout(
    sidebarPanel(
      selectInput('cuisine', 'Select Cuisine', unique(recipes$cuisine)),
      sliderInput('nb_ingredients', 'Select No. of Ingredients', 5, 100, 20),
    ),
    mainPanel(
      tabsetPanel(
        # CODE BELOW: Add `d3wordcloudOutput` named `wc_ingredients` in a `tabPanel`

        tabPanel('Plot', plotly::plotlyOutput('plot_top_ingredients')),
        tabPanel('Table', DT::DTOutput('dt_top_ingredients'))
      )
    )
  )
)

server <- function(input, output, session){
  # CODE BELOW: Render an interactive wordcloud of top ingredients and
  # the number of recipes they get used in, using `d3wordcloud::renderD3wordcloud`,
  # and assign it to an output named `wc_ingredients`.


  rval_top_ingredients <- reactive({
    recipes_enriched %>%
      filter(cuisine == input$cuisine) %>%
      arrange(desc(tf_idf)) %>%
      head(input$nb_ingredients) %>%
      mutate(ingredient = forcats::fct_reorder(ingredient, tf_idf))
  })
  output$plot_top_ingredients <- plotly::renderPlotly({
    rval_top_ingredients() %>%
      ggplot(aes(x = ingredient, y = tf_idf)) +
      geom_col() +
      coord_flip()
  })
  output$dt_top_ingredients <- DT::renderDT({
    recipes %>%
      filter(cuisine == input$cuisine) %>%
      count(ingredient, name = 'nb_recipes') %>%
      arrange(desc(nb_recipes)) %>%
      head(input$nb_ingredients)
  })
}

shinyApp(ui = ui, server= server)