Valider les clusters
Dans le graphique ci-dessous, vous voyez les résultats de clustering sur les mêmes données de composition que précédemment, avec quelques légères modifications dans les étapes de clustering.
- Le graphique de gauche a été généré avec
k=2etmethod = 'average' - Le graphique de droite a été généré avec
k=3etmethod = 'complete'
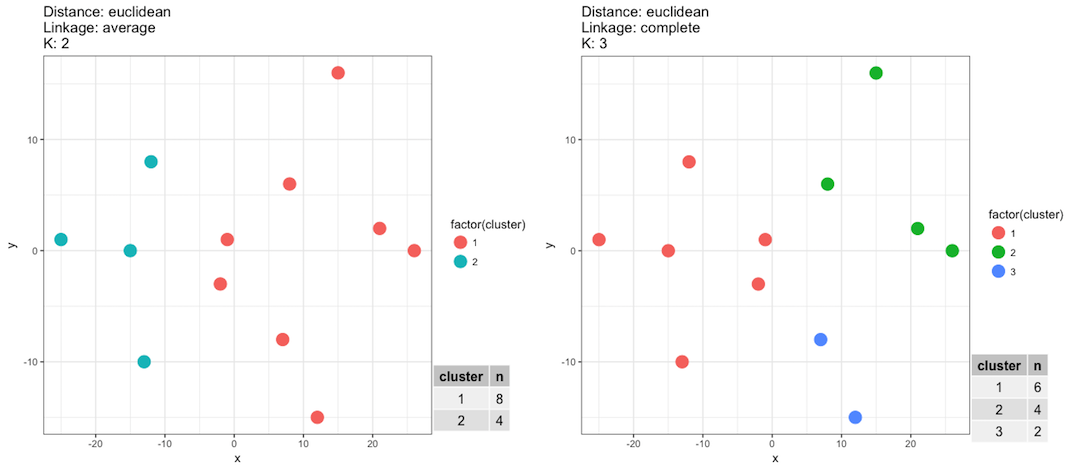
Si notre objectif est d’affecter correctement chaque joueur à son équipe, alors d’après ce que vous voyez ci-dessus et ce que vous savez du jeu de données, lesquelles des affirmations suivantes sont correctes ?
Cet exercice fait partie du cours
<cours>Analyse de clusters avec R</cours>Exercice interactif pratique
Transformez la théorie en action avec l’un de nos exercices interactifs
 Commencer l’exercice