Bombas nucleares por país
Te han dado una versión de la Nuclear Explosion DataBase (NEDB) donde los nombres de los países aparecen en los encabezados de columna (nuke_df). Quieres visualizar cuántas bombas se detonaron por año y por país. Primero tendrás que pivotar los datos y sustituir los valores NA.
El paquete ggplot2 ya está cargado.
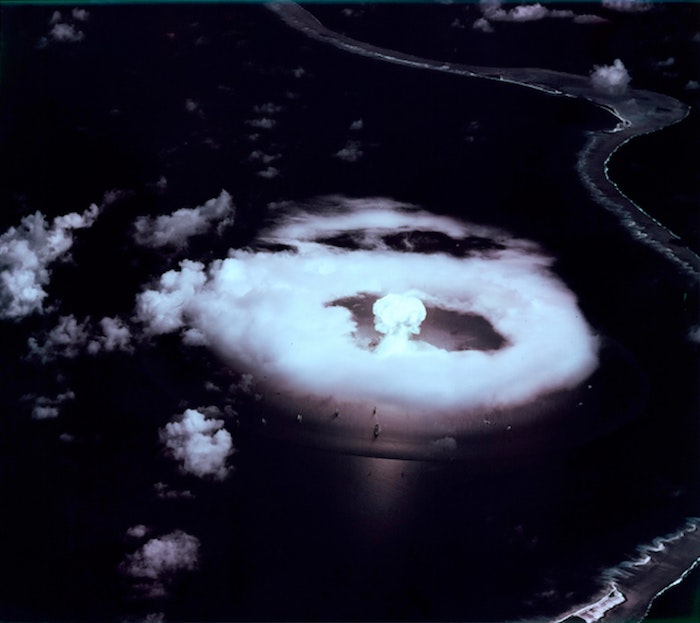
"A-Day" Primera explosión de bomba atómica en Bikini, Islas Marshall, 1 de julio de 1946.
Este ejercicio forma parte del curso
Reestructurar datos con tidyr
ejercicio interactivo práctico
Prueba este ejercicio completando este código de ejemplo.
nuke_df %>%
  # Pivot the data to a longer format
  ___