Identificar derivas relevantes
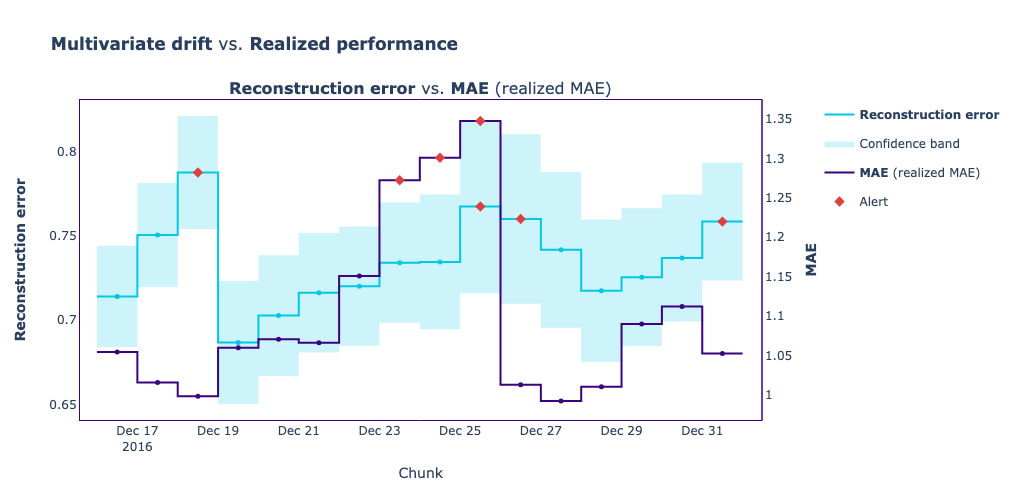
Recuerda el ejemplo del conjunto de datos de Green Taxi del capítulo 2, donde el modelo predecía la cantidad de propina. En este ejercicio, hemos preparado una gráfica comparativa que muestra los valores diarios del error de reconstrucción obtenido con el método de detección de deriva multivariante, en azul claro, junto con el rendimiento realizado calculado con la métrica MAE, en azul oscuro.
Tu tarea ahora es identificar el día en el que una deriva con alerta coincide con una alerta en el rendimiento del modelo.
Este ejercicio forma parte del curso
Monitorización de Machine Learning en Python
ejercicio interactivo práctico
Convierte la teoría en práctica con uno de nuestros ejercicios interactivos
 Empezar ejercicio