Interpretar resultados
En este escenario, has implementado con éxito tu algoritmo de estimación de rendimiento en un entorno de producción. Como resultado, tienes una gráfica para la métrica ROC AUC estimada.
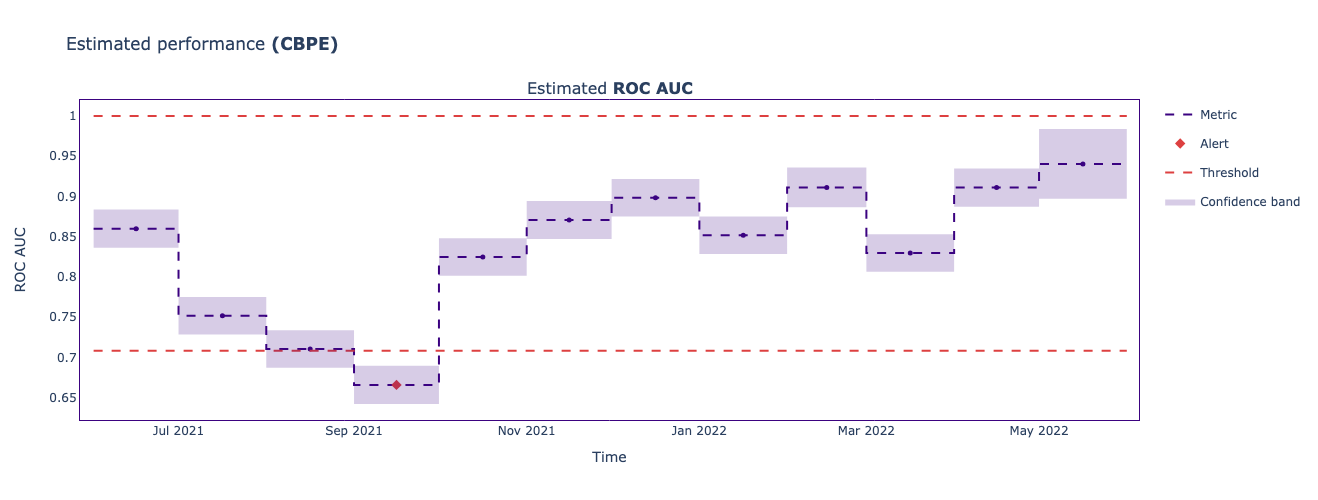
Tu tarea ahora es seleccionar la información correcta basada en la gráfica sobre lo siguiente:
- periodo del bloque (chunk period): un único punto de datos en los resultados de monitorización
- umbral superior
- umbral inferior
- el nombre del mes en el que se activa una alerta de rendimiento
Este ejercicio forma parte del curso
Monitorización de Machine Learning en Python
ejercicio interactivo práctico
Convierte la teoría en práctica con uno de nuestros ejercicios interactivos
 Empezar ejercicio