Uso del color
El color es uno de los atributos más utilizados en visualización de datos.
No es casualidad que muchas organizaciones tengan manuales con estándares de uso del color para respetar su identidad de marca y también por motivos de accesibilidad.
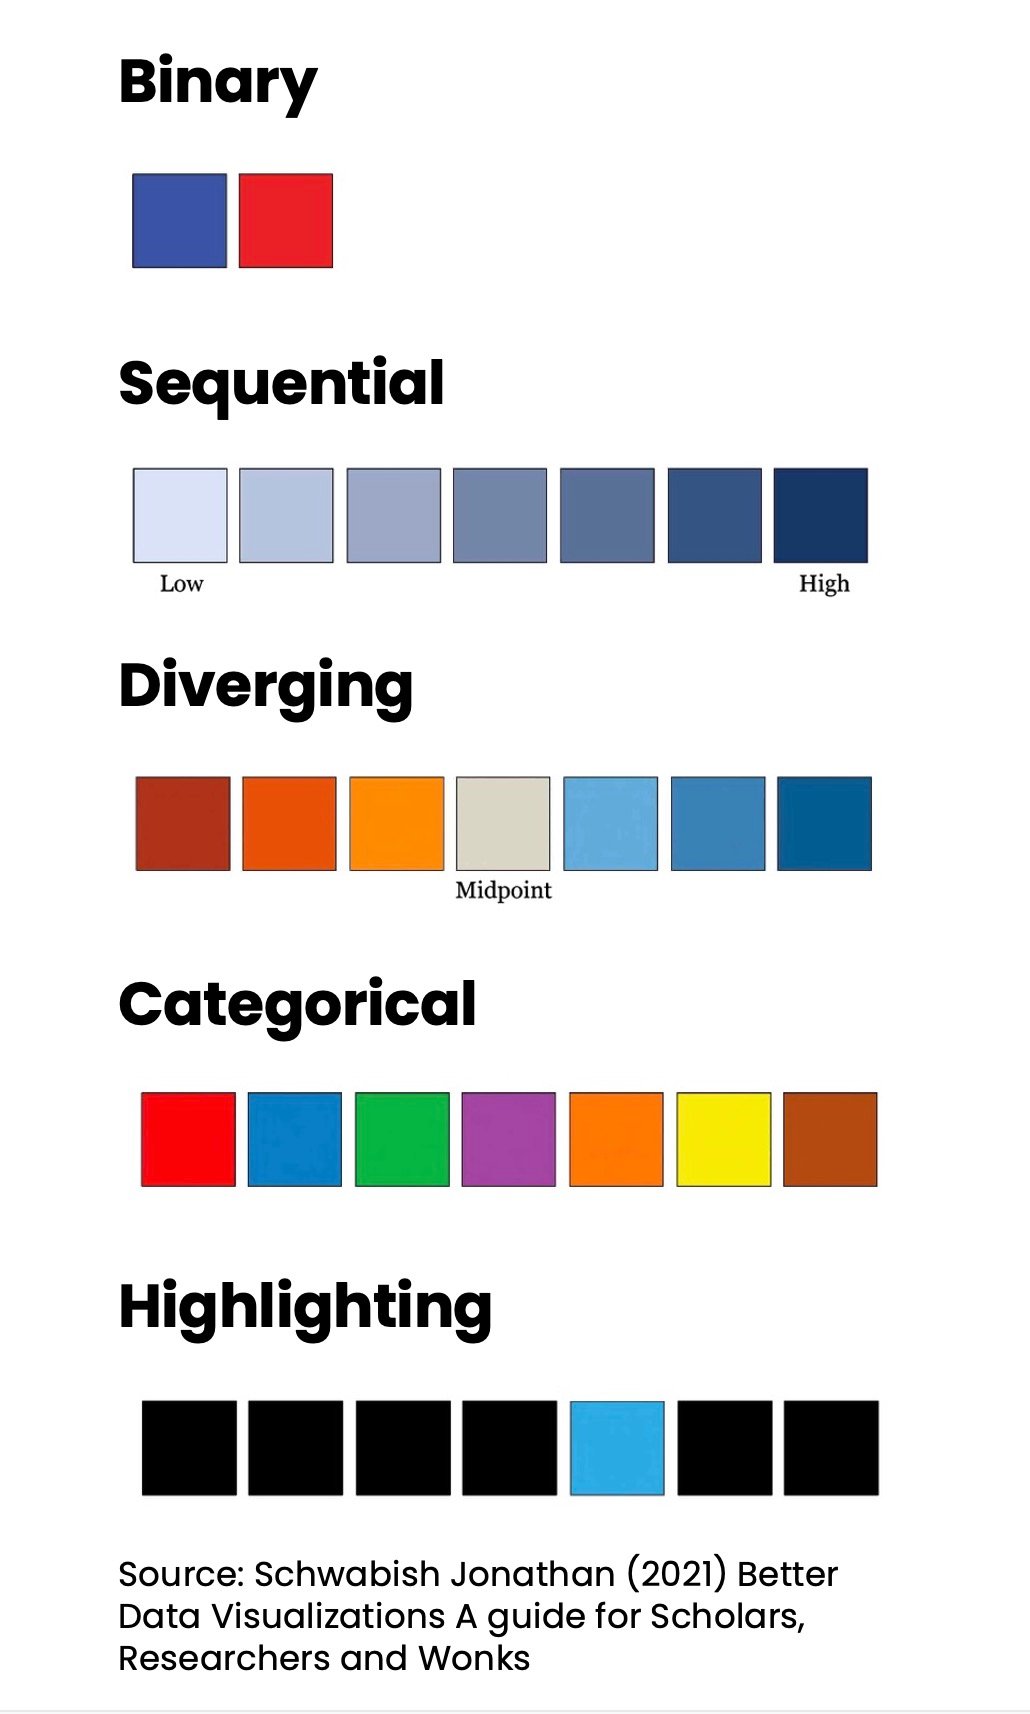
Hay cinco esquemas de color principales que puedes aplicar a tus visualizaciones:
Este ejercicio forma parte del curso
Estudio de caso de Data Storytelling: Negocios verdes
ejercicio interactivo práctico
Convierte la teoría en práctica con uno de nuestros ejercicios interactivos
 Empezar ejercicio