Histogramme interpretieren
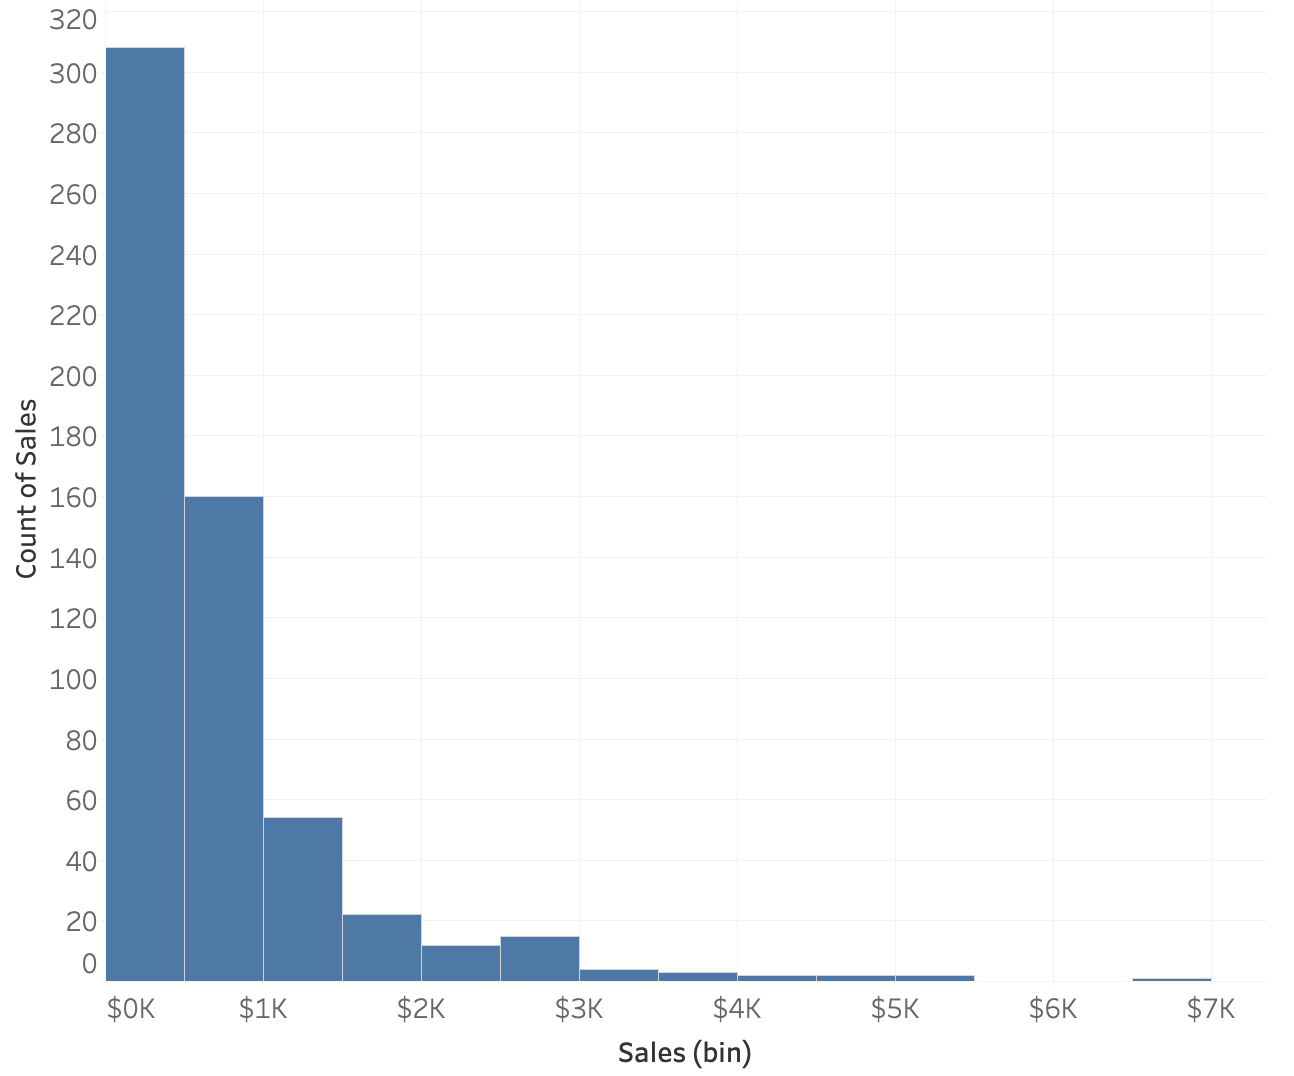
Hier siehst du ein Histogramm der Verkäufe aus Bestellungen für Bürobedarf. Jede Zeile im Datensatz steht für eine Bestellung, daher hat jede Bestellung einen Verkaufswert.
Tipp: Dieses linke Text- und Anleitungsfenster in der Übung ist in der Größe anpassbar. Wenn die Grafik zu klein ist, kannst du sie größer ziehen.
Diese Übung ist Teil des Kurses
<Kurs>Statistische Techniken in Tableau</Kurs>Interaktive praktische Übung
Verwandle Theorie mit einer unserer interaktiven Übungen in die Praxis
 Übung starten