Identifiziere den Ausreißer
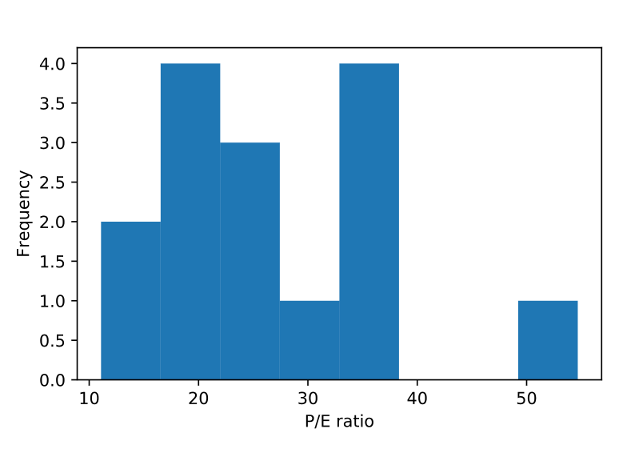
Histogramme können dir dabei helfen, Ausreißer oder ungewöhnliche Datenpunkte zu erkennen. Welches Kurs-Gewinn-Verhältnis in diesem Histogramm ist ein Beispiel für einen Ausreißer?
Diese Übung ist Teil des Kurses
<Kurs>Einführung in Python für den Finanzbereich</Kurs>Interaktive praktische Übung
Verwandle Theorie mit einer unserer interaktiven Übungen in die Praxis
 Übung starten