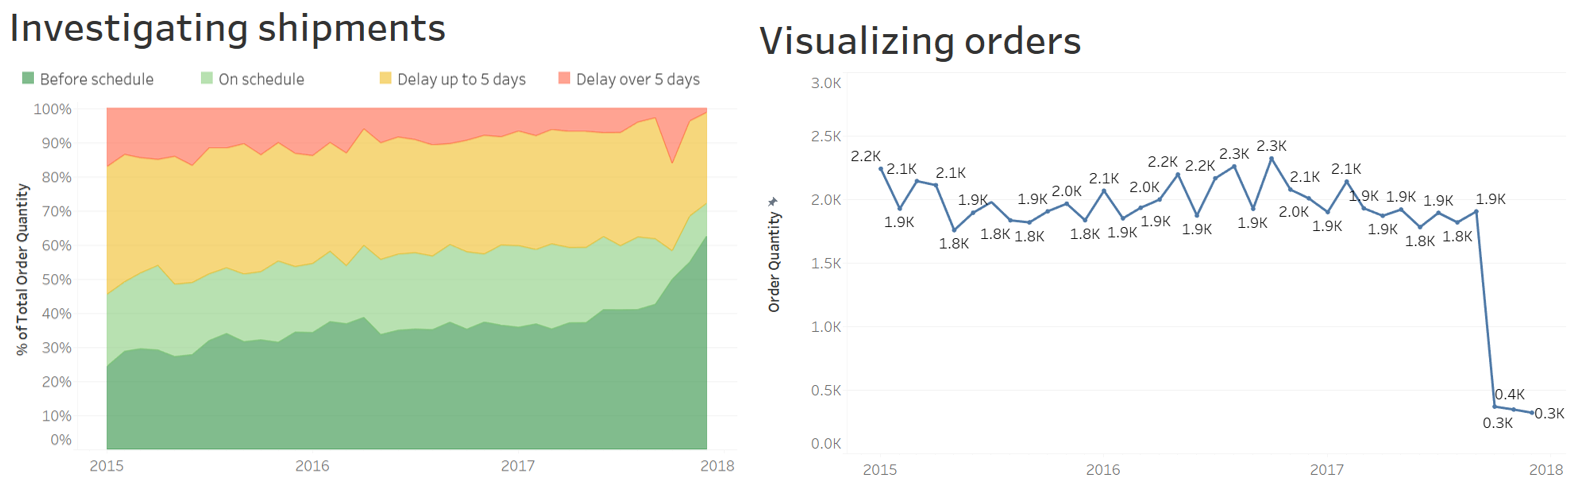
Drawing conclusions from the charts
Which sentence(s) summarize(s) these two visualizations correctly?
Diese Übung ist Teil des Kurses
<Kurs>Case Study: Supply Chain Analytics in Tableau</Kurs>Interaktive praktische Übung
Verwandle Theorie mit einer unserer interaktiven Übungen in die Praxis
 Übung starten