Prozkoumej kuchyně: wordcloudy
Doufám, že tě tvorba těchto kulinářských Shiny aplikací baví! Skvělý způsob, jak přehledně zobrazit velké množství dat, jsou wordcloudy. V tomto cvičení rozšíříš aplikaci, kterou jsme postavili dříve, a přidáš novou záložku s interaktivním wordcloudem nejcharakterističtějších ingrediencí.
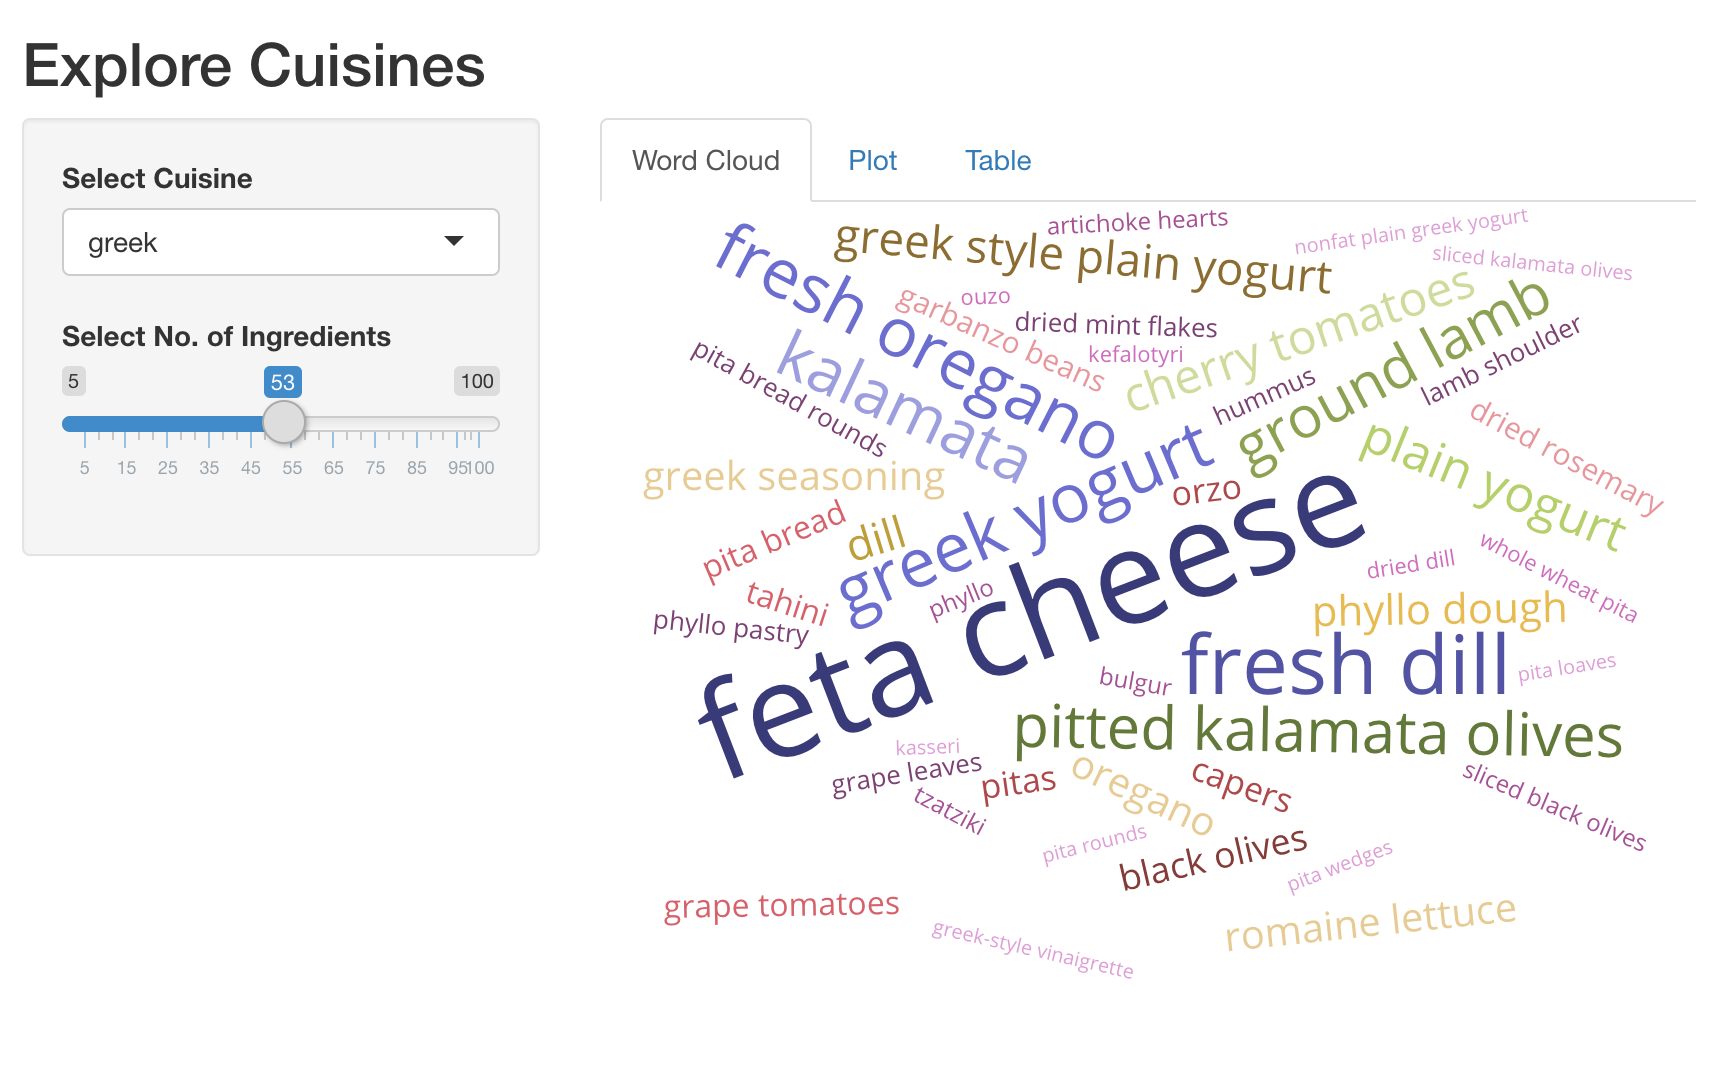
Balíčky shiny, dplyr, ggplot2, plotly a d3wordcloud jsou už načtené. Tady je ukázka, jak wordcloud vytvořit:
d3wordcloud(
  words = c('hello', 'world', 'good'),
  freqs = c(20, 40, 30),
  tooltip = TRUE
)
Toto cvičení je součástí kurzu
Tvorba webových aplikací se Shiny v R
Pokyny k cvičení
- UI: Přidej
d3wordcloudOutput()s názvemwc_ingredientsa vlož ho dotabPanel(). Tato záložka by měla být v aplikaci jako první. - Server: Vyrenderuj interaktivní wordcloud nejčastějších ingrediencí a počtu receptů, ve kterých se používají. Použij
d3wordcloud::renderD3wordcloud()a výsledek přiřaď k výstupuwc_ingredients. Budeš potřebovat reaktivní výrazrval_top_ingredients(), který vrátí datový rámec s nejčastějšími ingrediencemi a počty receptů.
Interaktivní cvičení na vyzkoušení si v praxi
Vyzkoušejte si toto cvičení dokončením tohoto ukázkového kódu.
ui <- fluidPage(
  titlePanel('Explore Cuisines'),
  sidebarLayout(
    sidebarPanel(
      selectInput('cuisine', 'Select Cuisine', unique(recipes$cuisine)),
      sliderInput('nb_ingredients', 'Select No. of Ingredients', 5, 100, 20),
    ),
    mainPanel(
      tabsetPanel(
        # CODE BELOW: Add `d3wordcloudOutput` named `wc_ingredients` in a `tabPanel`

        tabPanel('Plot', plotly::plotlyOutput('plot_top_ingredients')),
        tabPanel('Table', DT::DTOutput('dt_top_ingredients'))
      )
    )
  )
)

server <- function(input, output, session){
  # CODE BELOW: Render an interactive wordcloud of top ingredients and
  # the number of recipes they get used in, using `d3wordcloud::renderD3wordcloud`,
  # and assign it to an output named `wc_ingredients`.


  rval_top_ingredients <- reactive({
    recipes_enriched %>%
      filter(cuisine == input$cuisine) %>%
      arrange(desc(tf_idf)) %>%
      head(input$nb_ingredients) %>%
      mutate(ingredient = forcats::fct_reorder(ingredient, tf_idf))
  })
  output$plot_top_ingredients <- plotly::renderPlotly({
    rval_top_ingredients() %>%
      ggplot(aes(x = ingredient, y = tf_idf)) +
      geom_col() +
      coord_flip()
  })
  output$dt_top_ingredients <- DT::renderDT({
    recipes %>%
      filter(cuisine == input$cuisine) %>%
      count(ingredient, name = 'nb_recipes') %>%
      arrange(desc(nb_recipes)) %>%
      head(input$nb_ingredients)
  })
}

shinyApp(ui = ui, server= server)