Interpreting dendrogram
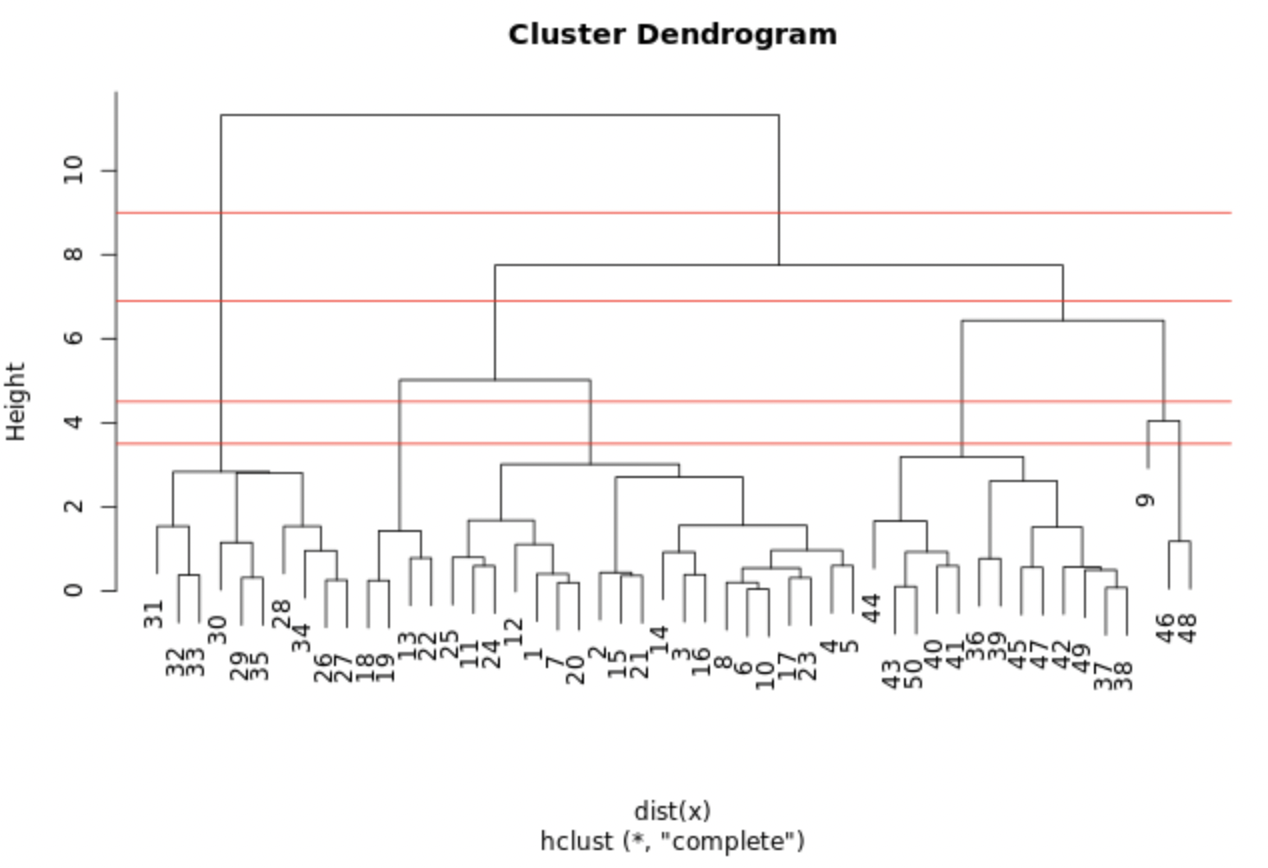
The plot displayed shows the hclust.out model you constructed in the previous exercise. We've drawn horizontal lines at heights of 3.5, 4.5, 6.9, and 9.0, respectively.
Which cut point yields 3 clusters?
This exercise is part of the course
Unsupervised Learning in R
Hands-on interactive exercise
Turn theory into action with one of our interactive exercises
 Start Exercise