k-means clustering
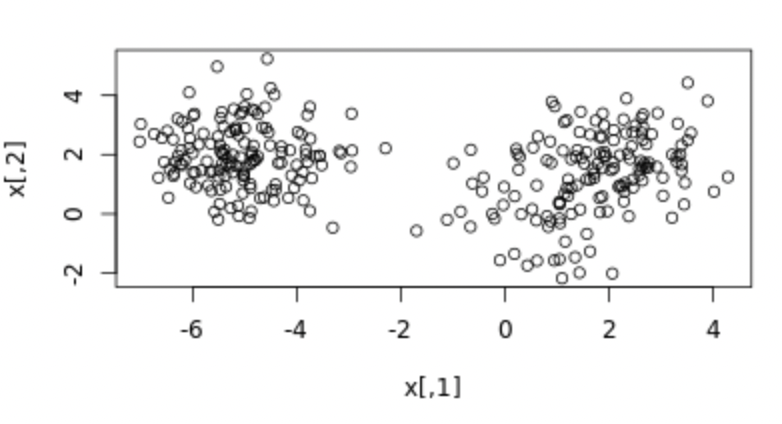
We have created some two-dimensional data and stored it in a variable called x in your workspace. The scatter plot shown is a visual representation of the data.
In this exercise, your task is to create a k-means model of the x data using 3 clusters, then to look at the structure of the resulting model using the summary() function.
This exercise is part of the course
Unsupervised Learning in R
Exercise instructions
- Fit a k-means model to
xusing 3 centers and run the k-means algorithm 20 times. Store the result inkm.out. - Inspect the result with the
summary()function.
Hands-on interactive exercise
Have a go at this exercise by completing this sample code.
# Create the k-means model: km.out


# Inspect the result