Explaining university admissions
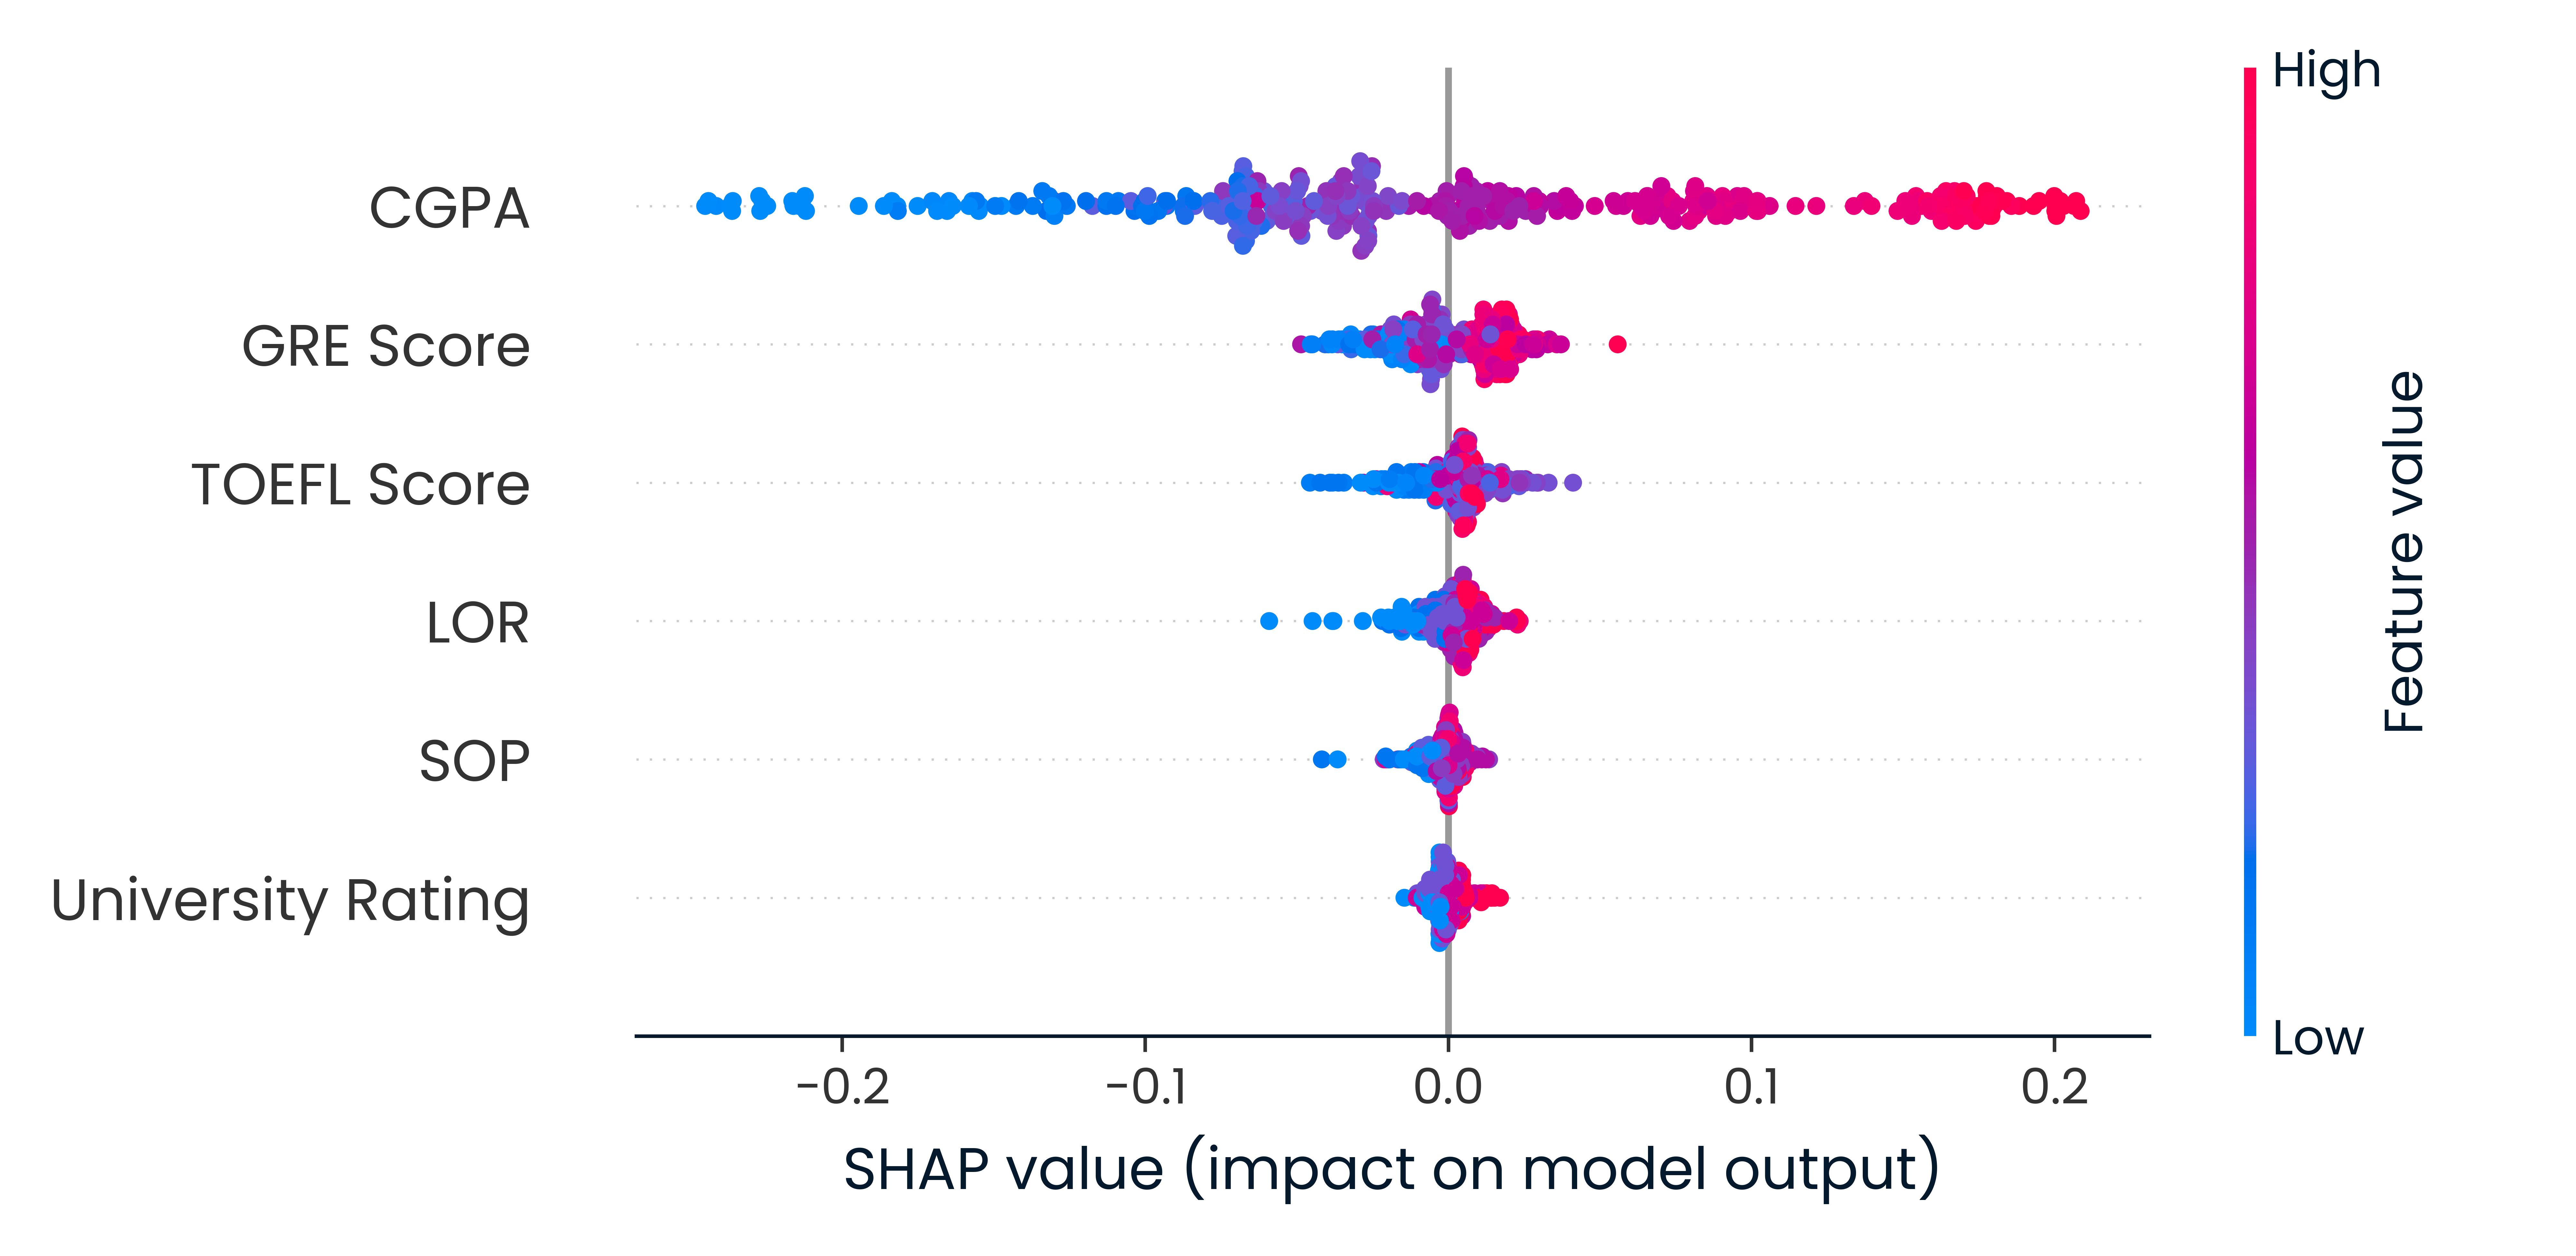
Below is a SHAP visualization of the importance of data features used in a regression model to estimate the likelihood of university admission, using different common U.S. academic test scores (CGPA; Cumulative Grade Point Average, GRE; Graduate Record Examination, etc.) as predictor attributes or features.
- The plot shows the relative importance of predictor attributes (academic test scores) in the inference process applied by the model for estimating the quality of a given observation (a student admission decision).
- The range of feature values is represented by colors ranging from blue (lowest) to pink (highest). The position of each feature's colored bar concerning the horizontal axis shows the effect feature values have in the resulting model output: some features' values lead to higher outputs when they are higher, while some other features' values lead to lower outputs when they are higher.

Take a close look at the above SHAP plot, and select which of the following statements about model explainability and feature importance are true:
This exercise is part of the course
Understanding Artificial Intelligence
Hands-on interactive exercise
Turn theory into action with one of our interactive exercises
 Start Exercise