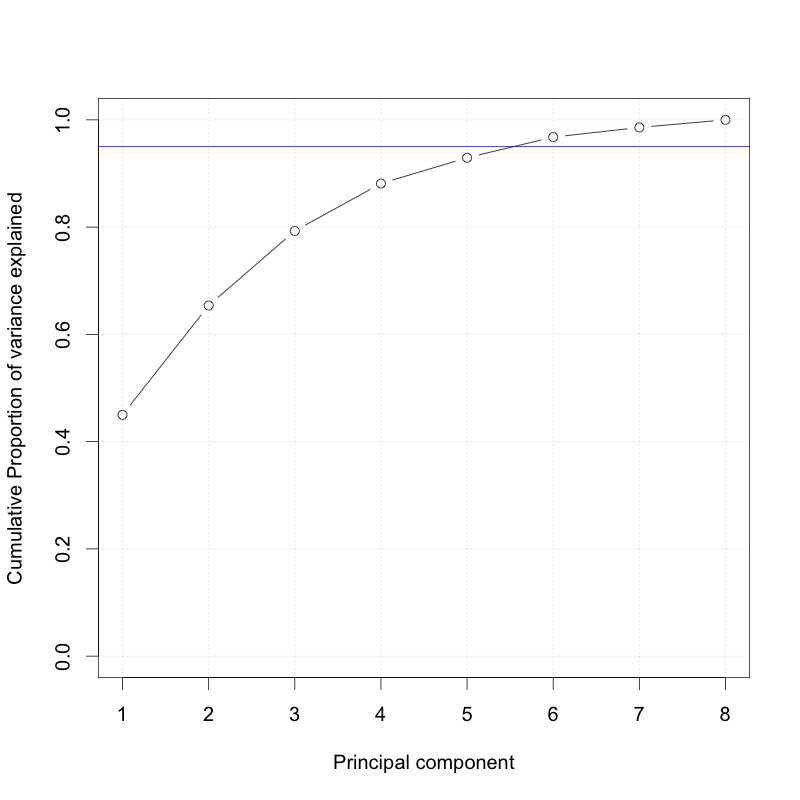
Number of components explaining 95% variation
Based on the plot from the previous exercise, which is shown below, how many components are needed to explain 95% of the variation in the data?
This exercise is part of the course
Multivariate Probability Distributions in R
Hands-on interactive exercise
Turn theory into action with one of our interactive exercises
 Start Exercise