Identify the distribution of a normal sample
Below you will find a ggpairs plot from a trivariate normal sample with n = 1000.
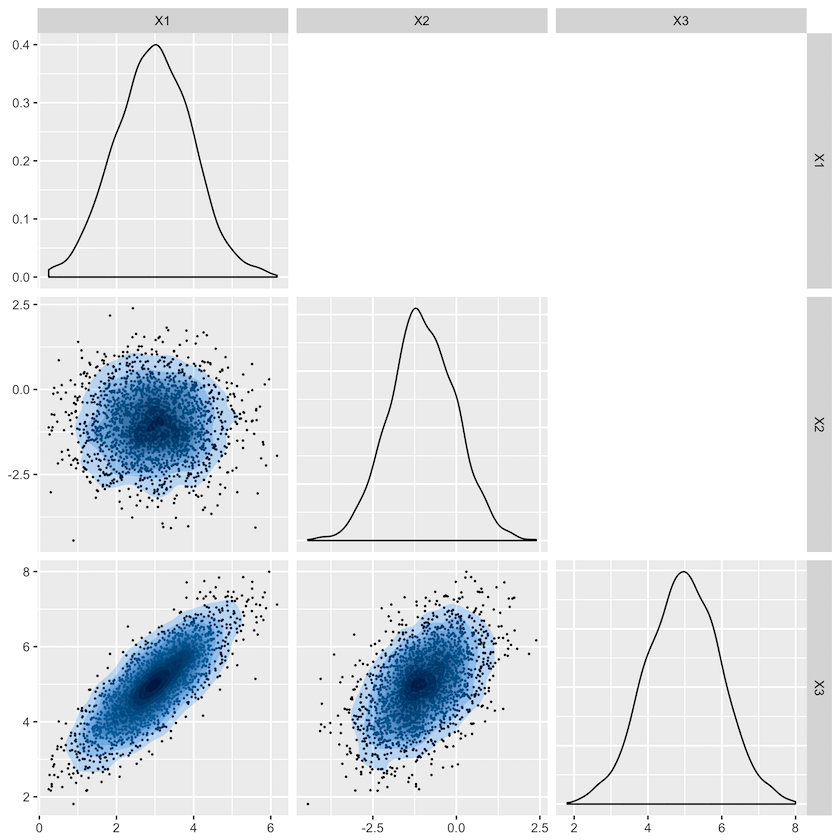
Which is the most likely pair of mu and sigma that generated this sample?
$$\mbox{(a)}\quad \mu= \begin{pmatrix} 3 \\ 1 \\ 2 \end{pmatrix}, \Sigma={\begin{pmatrix} 1 & 0.6 & 0.4 \\ 0.6 & 1 & 0.5 \\ 0.4 & 0.5 & 1 \end{pmatrix}}$$
$$ \mbox{(b)} \quad\mu= \begin{pmatrix} 3 \\ 1 \\ 2 \end{pmatrix}, \Sigma={\begin{pmatrix} 1 & 0 & 0.8 \\ 0 & 1 & 0.5 \\ 0.8 & 0.5 & 1 \end{pmatrix}}$$
$$\mbox{(c)} \quad\mu= \begin{pmatrix} 3 \\ -1 \\ 5 \end{pmatrix}, \Sigma={\begin{pmatrix} 1 & 0.6 & 0.4 \\ 0.6 & 1 & 0.5 \\ 0.4 & 0.5 & 1 \end{pmatrix}}$$
$$\mbox{(d)} \quad \mu= \begin{pmatrix} 3 \\ -1 \\ 5 \end{pmatrix}, \Sigma={\begin{pmatrix} 1 & 0 & 0.8 \\ 0 & 1 & 0.5 \\ 0.8 & 0.5 & 1 \end{pmatrix}}$$
This exercise is part of the course
Multivariate Probability Distributions in R
Hands-on interactive exercise
Turn theory into action with one of our interactive exercises
 Start Exercise