Identifying relevant drifts
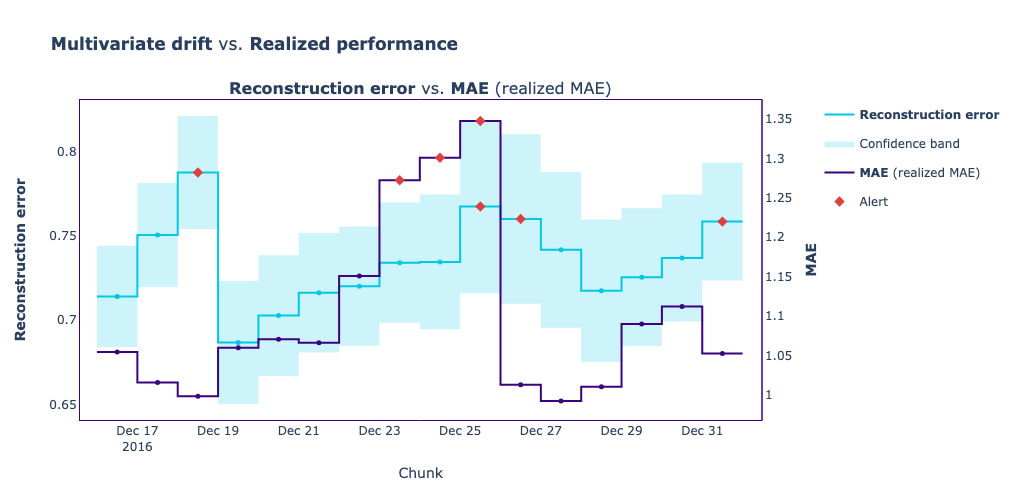
Recall the Green Taxi dataset example from Chapter 2, where the model was predicting the tip amount. In this exercise, we've prepared a comparison plot that illustrates the daily values of the reconstruction error obtained from the multivariate drift detection method, shown in light blue, alongside the realized performance calculated using the MAE metric, which is plotted in dark blue.
Your task now is to identify the day when an alerted drift overlaps with an alert in the model's performance.
This exercise is part of the course
Monitoring Machine Learning in Python
Hands-on interactive exercise
Turn theory into action with one of our interactive exercises
 Start Exercise