Interpreting results
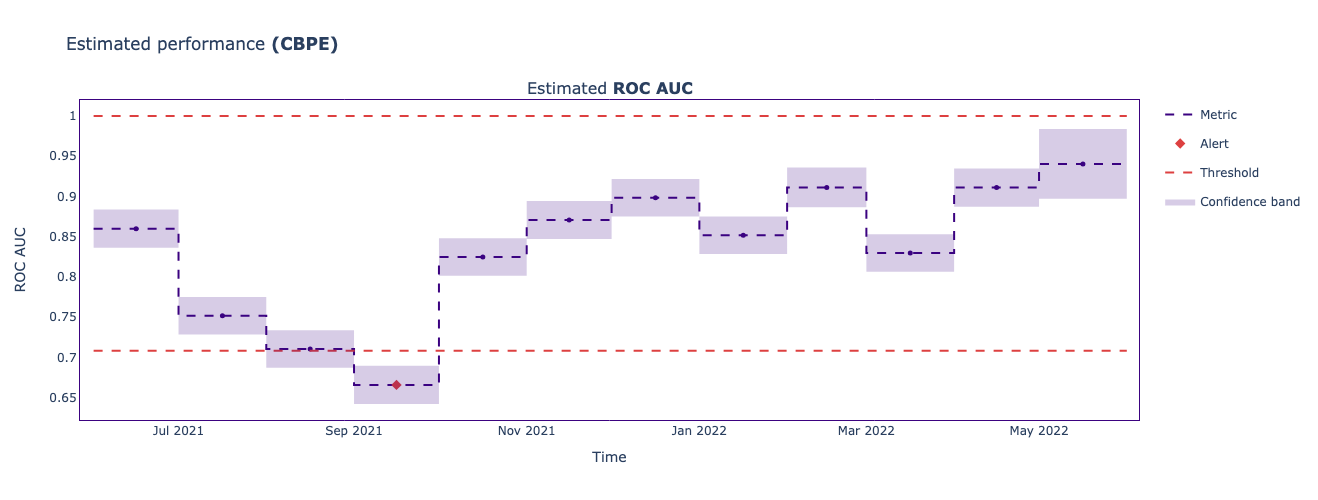
In this scenario, you've successfully implemented your performance estimation algorithm in a production environment. As a result, you have a plot for estimated ROC AUC metric.
Your task now is to select correct information based on the plot about the following:
- chunk period - a single data point on the monitoring results
- upper threshold
- lower threshold
- the name of the month when a performance alert is triggered
This exercise is part of the course
Monitoring Machine Learning in Python
Hands-on interactive exercise
Turn theory into action with one of our interactive exercises
 Start Exercise