CIs and confidence level
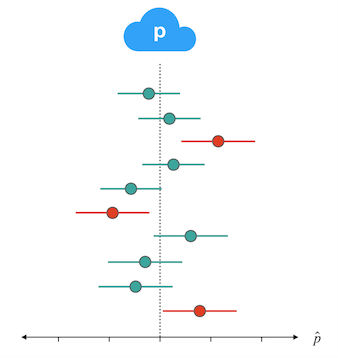
We learned that for a 95% confidence interval (a confidence level of .95), if we were to take many samples of the same size and compute many intervals, we would expect 95% of the resulting intervals to contain the parameter. Based on the set of confidence intervals plotted here, what is your best guess at the confidence level used in these intervals?
As in the video, the population proportion is represented by the p in the cloud and the dotted line and each confidence interval is represented by a segment that extends out from it's p-hat. Intervals that capture the true value are in green; those that miss it are in red.
This exercise is part of the course
Inference for Categorical Data in R
Hands-on interactive exercise
Turn theory into action with one of our interactive exercises
 Start Exercise