Understanding contingency tables
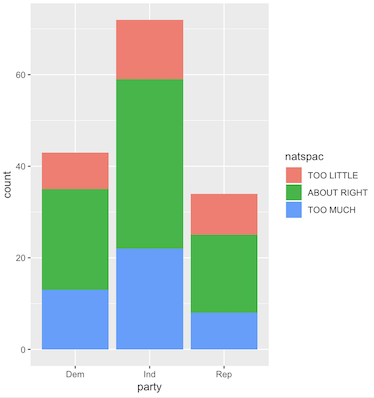
The bar plot of counts that you constructed is a visual representation of a contingency table.
Which of the following is FALSE regarding contingency tables?
This exercise is part of the course
Inference for Categorical Data in R
Hands-on interactive exercise
Turn theory into action with one of our interactive exercises
 Start Exercise