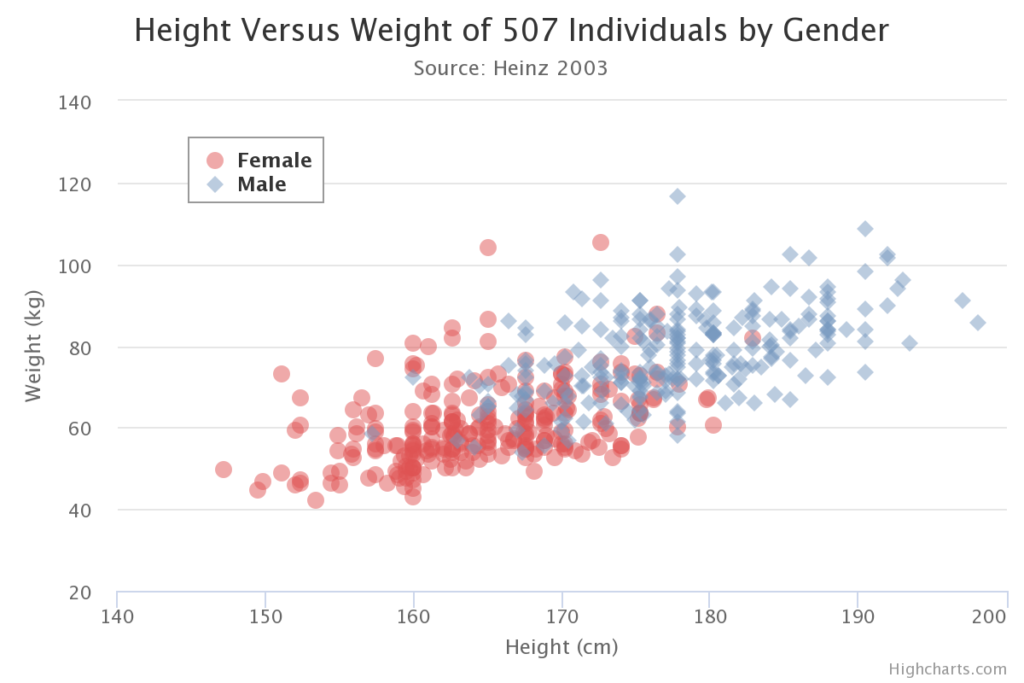
Practice interpreting a scatter plot
How would you describe the relationship of direction and strength, visualized by the scatter plot?
This exercise is part of the course
Exploratory Data Analysis in Power BI
Hands-on interactive exercise
Turn theory into action with one of our interactive exercises
 Start Exercise