Decluttering in practice
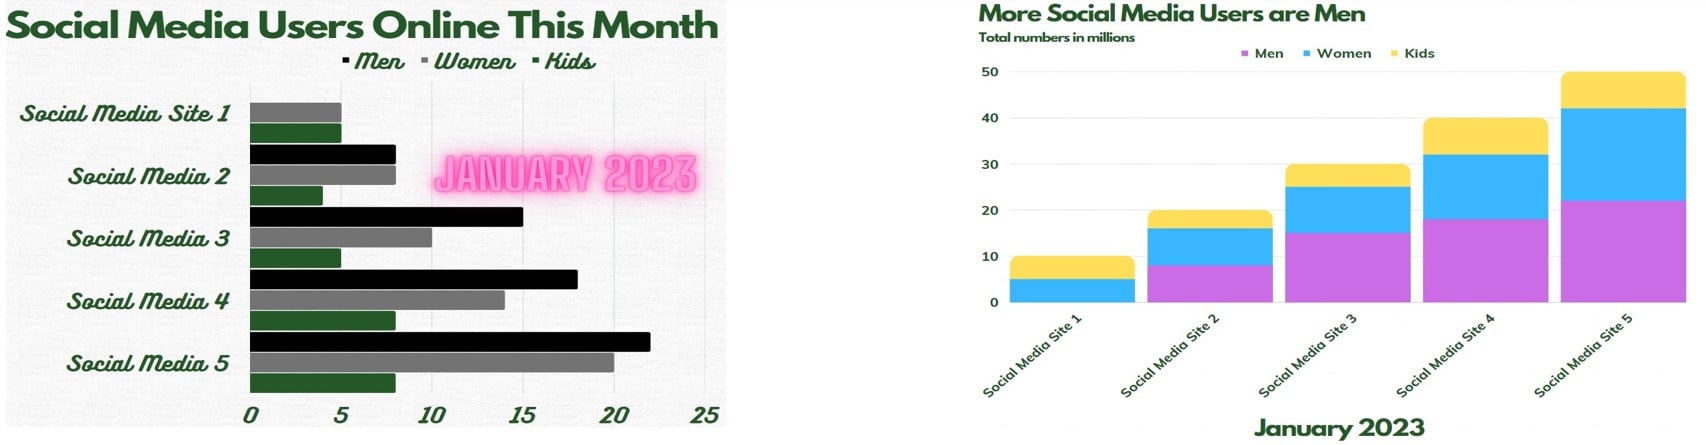
One of your co-workers produces a bar chart describing when men and women start gift shopping during the U.S. holiday season. The result was the chart on the left. It has too much clutter. Another co-worker volunteers to declutter the chart, and the result is on the right.
The chart on the right is less cluttered and more suitable for audience consumption.
They ask you to review their work so far, but to be sure you are spotting what was corrected, try sorting these chart features according to whether it was retained or discarded.
 source: https://www.storytellingwithdata.com/
This exercise is part of the course
Data Storytelling Concepts
Hands-on interactive exercise
Turn theory into action with one of our interactive exercises
 Start Exercise