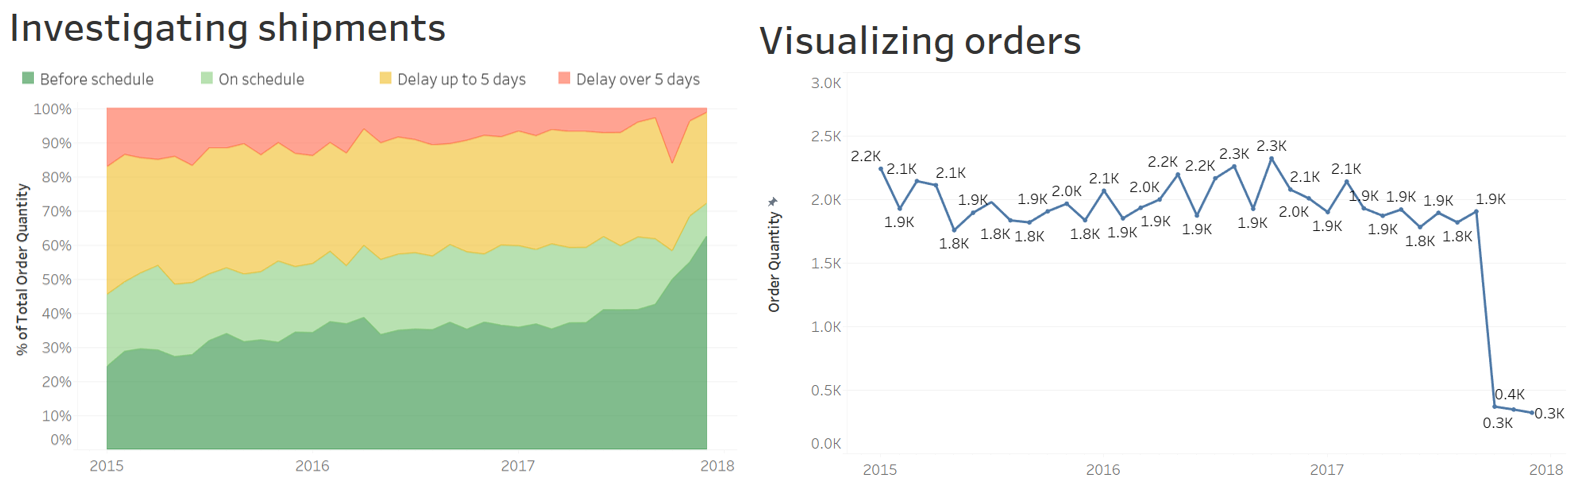
Drawing conclusions from the charts
Which sentence(s) summarize(s) these two visualizations correctly?
This exercise is part of the course
Case Study: Supply Chain Analytics in Tableau
Hands-on interactive exercise
Turn theory into action with one of our interactive exercises
 Start Exercise