Slice 3D images
The simplest way to plot 3D and 4D images by slicing them into many 2D frames. Plotting many slices sequentially can create a "fly-through" effect that helps you understand the image as a whole.
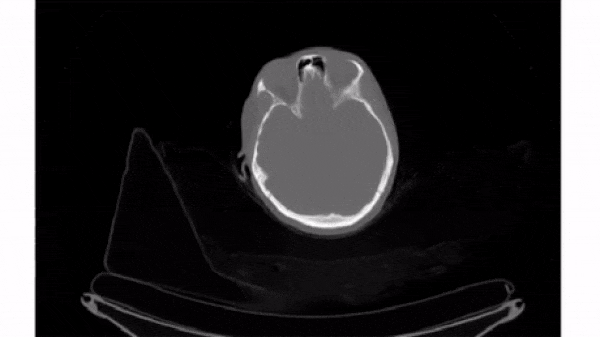
To select a 2D frame, pick a frame for the first axis and select all data from the remaining two: vol[0, :, :]
For this exercise, use for loop to plot every 40th slice of vol on a separate subplot. matplotlib.pyplot (as plt) has been imported for you.
This exercise is part of the course
Biomedical Image Analysis in Python
Exercise instructions
- Using
plt.subplots(), initialize a subplots grid with 1 row and 4 columns. - Plot every 40th slice of
volin grayscale. To get the appropriate index, multiplyiiby40. - Turn off the ticks, labels, and frame for each subplot.
- Render the figure.
Hands-on interactive exercise
Have a go at this exercise by completing this sample code.
# Plot the images on a subplots array
fig, axes = ____

# Loop through subplots and draw image
for ii in range(4):
    im = ____
    axes[ii].imshow(____, cmap='gray')
    axes[ii].axis(____)

# Render the figure
plt.show()