Unraveling campaign performance
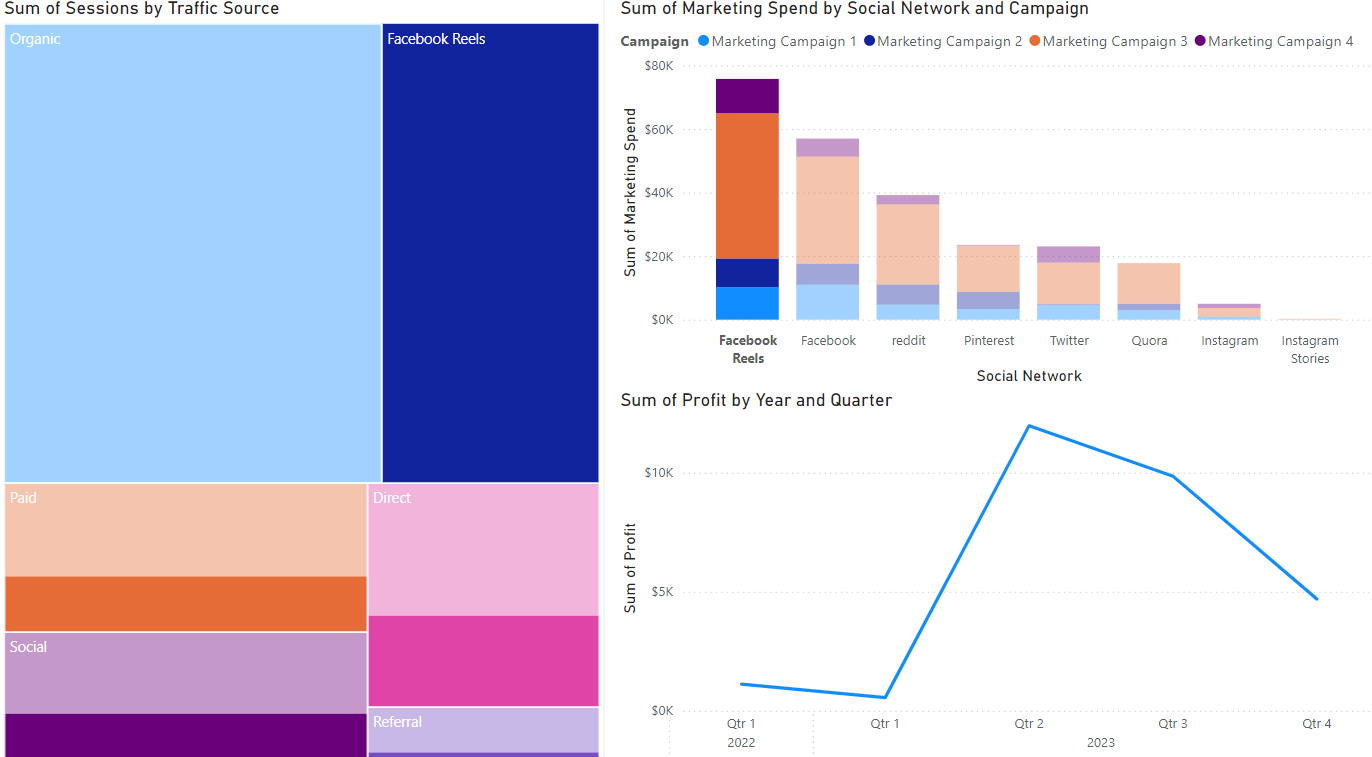
Campaign analysis time! Let's say you created a tree map (sessions by traffic source), a bar chart (marketing spend by channel), and a line graph (profit). The default view of your report tab is shown below.
Let's use these Power BI visualizations to dissect most profitable campaign and identify optimization opportunities.
Bài tập này là một phần của khóa học
Power BI for End Users
Bài tập tương tác thực hành
Biến lý thuyết thành hành động với một trong các bài tập tương tác của chúng tôi
 Bắt đầu bài tập