Khám phá ẩm thực: word cloud
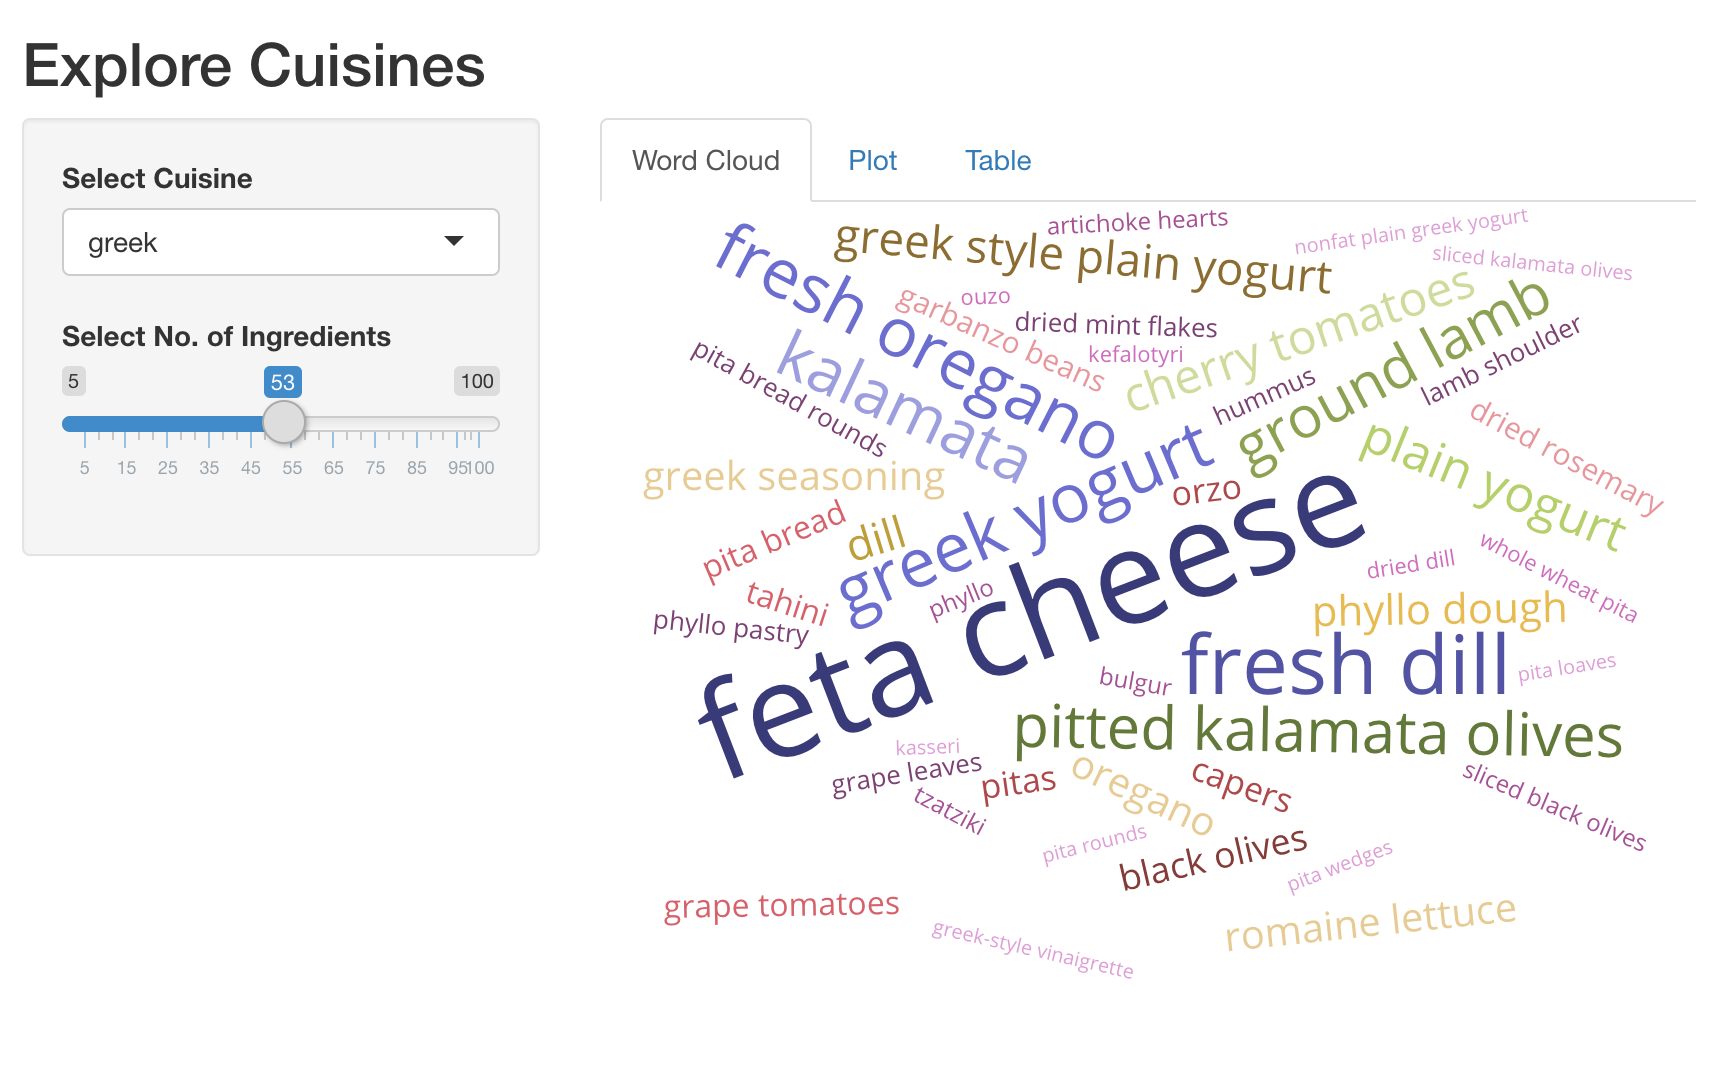
Hy vọng bạn đang thấy hứng thú khi xây dựng các ứng dụng Shiny về ẩm thực! Một cách tiện lợi để trực quan hóa rất nhiều dữ liệu là dùng word cloud. Ở bài này, bạn sẽ mở rộng ứng dụng Shiny đã xây trước đó và thêm một tab mới hiển thị các nguyên liệu đặc trưng hàng đầu dưới dạng word cloud tương tác.
Chúng tôi đã nạp sẵn các gói shiny, dplyr, ggplot2, plotly và
d3wordcloud. Đây là một đoạn mã tiện dụng để tạo word cloud.
d3wordcloud(
  words = c('hello', 'world', 'good'),
  freqs = c(20, 40, 30),
  tooltip = TRUE
)
Bài tập này là một phần của khóa học
Xây dựng ứng dụng web với Shiny trong R
Hướng dẫn bài tập
- UI: Thêm
d3wordcloudOutput()tênwc_ingredients, và bao nó trong mộttabPanel(). Đây phải làtabPanel()đầu tiên trong ứng dụng của bạn. - Server: Kết xuất một word cloud tương tác của các nguyên liệu hàng đầu và
số lượng công thức chúng được dùng, bằng cách sử dụng
d3wordcloud::renderD3wordcloud()và gán cho một output tênwc_ingredients. Bạn sẽ cần dùng biểu thức reactiverval_top_ingredients()để trả về một data frame các nguyên liệu hàng đầu kèm số lượng công thức.
Bài tập tương tác thực hành trực tiếp
Hãy thử làm bài tập này bằng cách hoàn thành đoạn mã mẫu này.
ui <- fluidPage(
  titlePanel('Explore Cuisines'),
  sidebarLayout(
    sidebarPanel(
      selectInput('cuisine', 'Select Cuisine', unique(recipes$cuisine)),
      sliderInput('nb_ingredients', 'Select No. of Ingredients', 5, 100, 20),
    ),
    mainPanel(
      tabsetPanel(
        # CODE BELOW: Add `d3wordcloudOutput` named `wc_ingredients` in a `tabPanel`

        tabPanel('Plot', plotly::plotlyOutput('plot_top_ingredients')),
        tabPanel('Table', DT::DTOutput('dt_top_ingredients'))
      )
    )
  )
)

server <- function(input, output, session){
  # CODE BELOW: Render an interactive wordcloud of top ingredients and
  # the number of recipes they get used in, using `d3wordcloud::renderD3wordcloud`,
  # and assign it to an output named `wc_ingredients`.


  rval_top_ingredients <- reactive({
    recipes_enriched %>%
      filter(cuisine == input$cuisine) %>%
      arrange(desc(tf_idf)) %>%
      head(input$nb_ingredients) %>%
      mutate(ingredient = forcats::fct_reorder(ingredient, tf_idf))
  })
  output$plot_top_ingredients <- plotly::renderPlotly({
    rval_top_ingredients() %>%
      ggplot(aes(x = ingredient, y = tf_idf)) +
      geom_col() +
      coord_flip()
  })
  output$dt_top_ingredients <- DT::renderDT({
    recipes %>%
      filter(cuisine == input$cuisine) %>%
      count(ingredient, name = 'nb_recipes') %>%
      arrange(desc(nb_recipes)) %>%
      head(input$nb_ingredients)
  })
}

shinyApp(ui = ui, server= server)