Інтерпретація гістограм
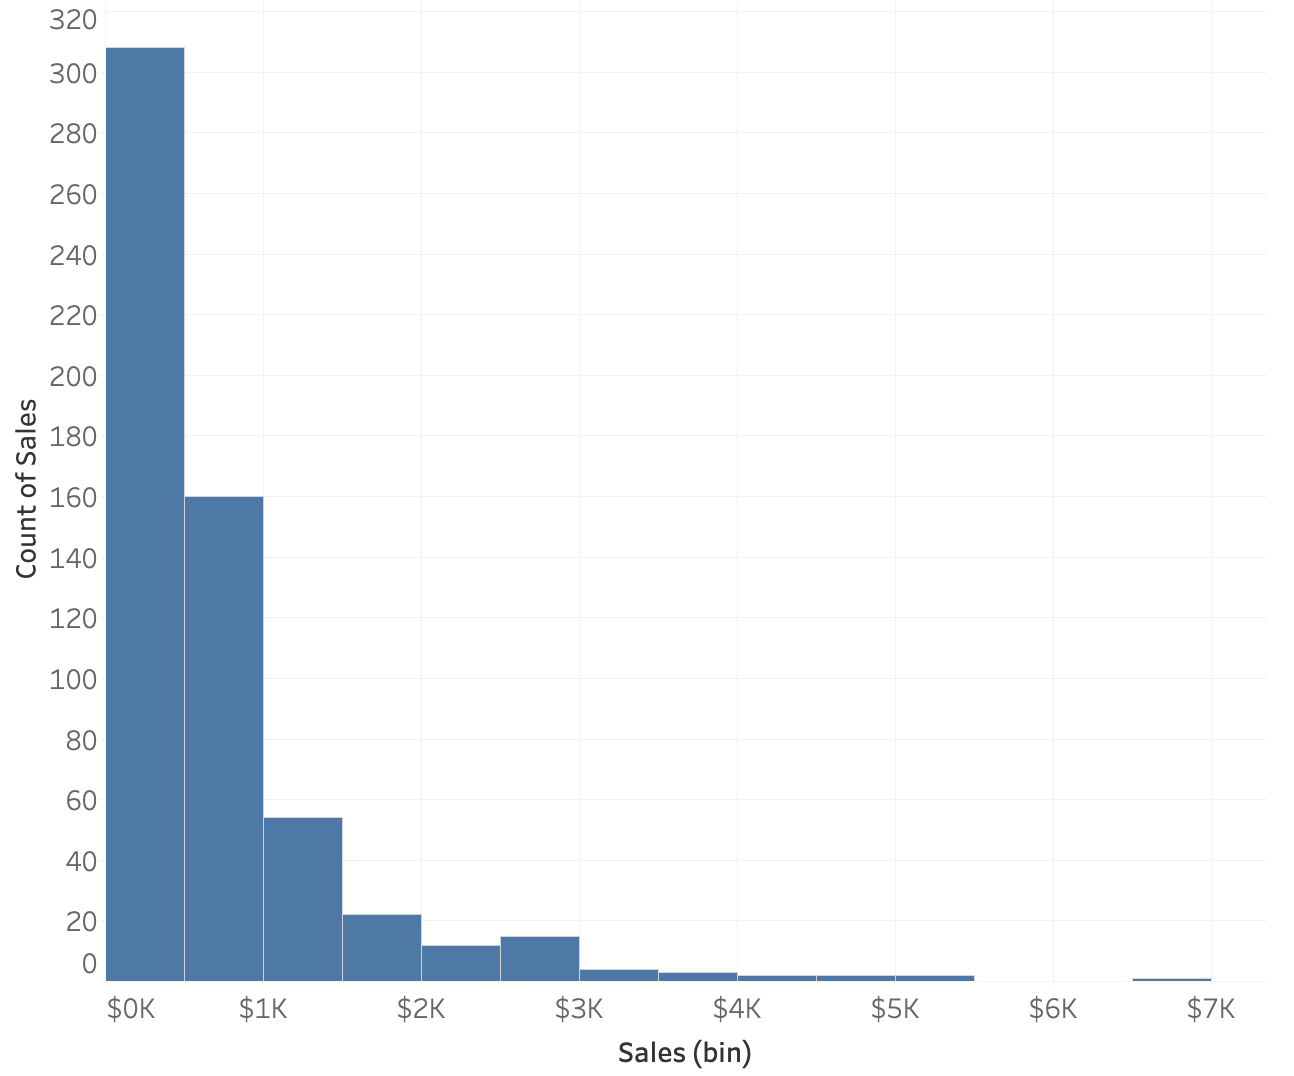
Ось гістограма продажів у замовленнях на канцелярські товари. Кожен рядок набору даних — це окреме замовлення, тож у кожного замовлення є одне значення продажу.
Порада: цю ліву панель вправи з текстом та інструкціями можна змінювати за розміром. Якщо графік надто малий, перетягніть край, щоб збільшити його.
Ця вправа є частиною курсу
Статистичні методи в Tableau
Практична інтерактивна вправа
Перетворіть теорію на практику за допомогою однієї з наших інтерактивних вправ
 Почати вправу