Kampanya performansını çözümleme
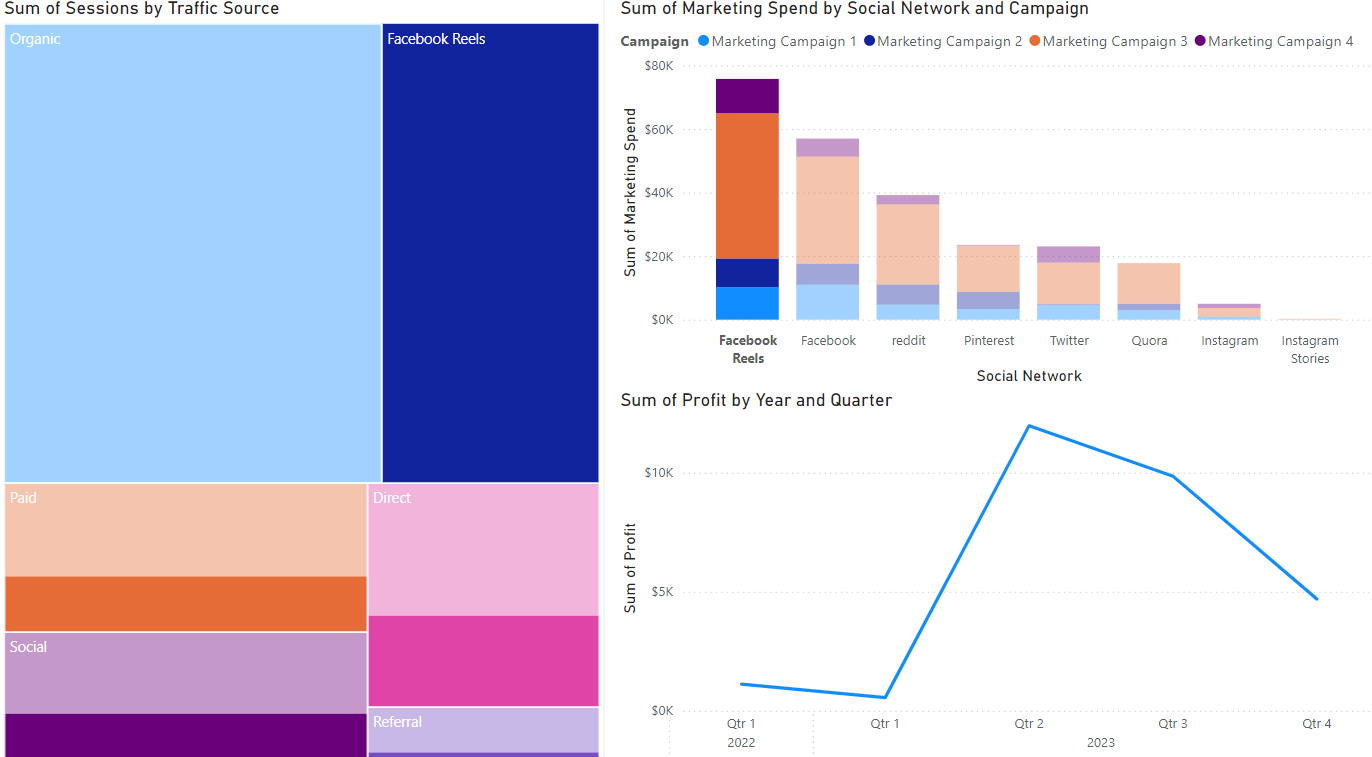
Kampanya analizi zamanı! Diyelim ki bir ağaç haritası (trafik kaynağına göre oturumlar), bir çubuk grafik (kanala göre pazarlama harcaması) ve bir çizgi grafik (kâr) oluşturdun. Rapor sekmenin varsayılan görünümü aşağıda gösteriliyor.
Hadi bu Power BI görselleştirmelerini kullanarak en kârlı kampanyayı parçalara ayıralım ve iyileştirme fırsatlarını belirleyelim.
Bu egzersiz, kursun bir parçasıdır
Son Kullanıcılar için Power BI
Uygulamalı etkileşimli egzersiz
Teoriyi etkileşime dönüştürün, interaktif egzersizlerimizden biriyle
 Egzersize başla