Renkleri ayarlama
Renk kodlu status ayarlarının dışında, valueBox() ve infoBox() gibi nesneler için ayarlanabilecek daha fazla renk vardır.
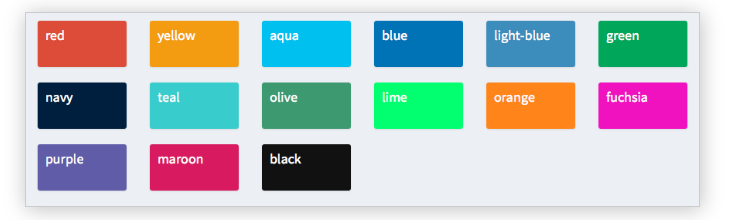
Aşağıda, bu nesneler daha önceki bir örnekte gördüğümüz gibi server() içinde de tanımlanabilse de, bir shinydashboard gövdesinde farklı renkler ayarlayacaksın.
Bu egzersizde, shiny ve shinydashboard kütüphaneleri senin için zaten yüklendi. Ayrıca, başlık ve kenar çubuğu sırasıyla header ve sidebar olarak kaydedildi ve server() boş bir fonksiyon.
Bu egzersiz, kursun bir parçasıdır
shinydashboard ile Panolar Oluşturma
Uygulamalı etkileşimli egzersiz
Bu egzersizi bu örnek kodu tamamlayarak deneyin.
library(shiny)
library(shinydashboard)

header <- dashboardHeader(
  title = "Portfolio dashboard for Sally",
  titleWidth = 300,
  dropdownMenu(type = "notifications",
       notificationItem("Sell alert", status = "danger"),
       notificationItem("Buy alert", status = "success"))
)

sidebar <- dashboardSidebar(
  width = 300,
  sidebarMenu(
    id = "pages",
    menuItem("Historical trends",
             tabName = "historical"),
    menuItem("Profits and Losses (PnLs)",
             tabName = "profit",
             icon = icon("money-bill-alt"),
             badgeLabel = "+2.3%", badgeColor = "green")
  )
)

body <- dashboardBody(tabItems(
  tabItem(tabName = "historical",
          fluidRow(box(selectInput("stock", "Select stock symbol",
                                   choices=c("AAPL", "DIS"))),
                   box("Stock name",
                       title="Stock name title",
                       width = 6,
                       status = "info", solidHeader = TRUE)),
          # Set the color of each infoBox to black
          fluidRow(infoBox("Open", "value", width = 2, color = ___),
                   infoBox("High", "value", width = 2,___),
                   infoBox("Low", "value", width = 2, ___),
                   infoBox("Close", "value", width = 2, ___),
                   # Set the color of the last infoBox to navy and set its width to 4
                   infoBox("Volume", "value", ___)),
          fluidRow(valueBox("Open (%)", "0%", width = 2),
                   valueBox("High (%)", "+1%", width = 2),
                   valueBox("Low (%)", "-4%", width = 2),
                   valueBox("Close (%)", "-2%", width = 2),
                   valueBox("Volume (%)", "+30%", width = 2)),
          fluidRow(box("Candlestick chart", width = 12, height = 350)),
          fluidRow(box("Volume chart", width = 12, height = 200))),
  tabItem(tabName = "profit",
          fluidRow(box("valueBox", "Account balance", width = 3),
                   box("valueBox",  "Value at Risk (Var)", width = 3),
                   box("valueBox", "Returns", width = 3),
                   box("valueBox", "Profit-to-loss ratio", width = 3)),
          fluidRow(box("PnL chart", width = 12, height = 400)))
)
)

ui <- dashboardPage(header, sidebar, body)
server <- function(input, output){}
shinyApp(ui, server)