Nuclear bombs per country
You've been given a version of the Nuclear Explosion DataBase (NEDB) where country names are specified in the column headers (nuke_df). You want to visualize how many nukes were detonated per year per country. You'll need to pivot the data and replace NA values first.
The ggplot2 package has been pre-loaded for you.
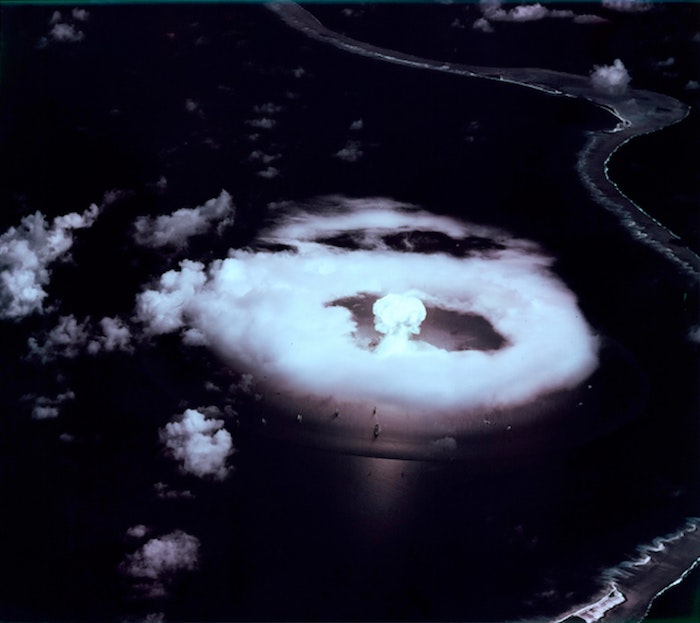
"A-Day" First atomic bomb explosion at Bikini in the Marshall Islands 1 July 1946.
แบบฝึกหัดนี้เป็นส่วนหนึ่งของหลักสูตร
Reshaping Data with tidyr
แบบฝึกหัดเชิงโต้ตอบแบบลงมือทำ
ลองทำแบบฝึกหัดนี้โดยเติมโค้ดตัวอย่างนี้ให้สมบูรณ์
nuke_df %>%
  # Pivot the data to a longer format
  ___