Sidebar layouts
Layout functions allow inputs and outputs to be visually arranged in the UI. A well-chosen layout makes a Shiny app aesthetically more appealing, and also improves the user experience.
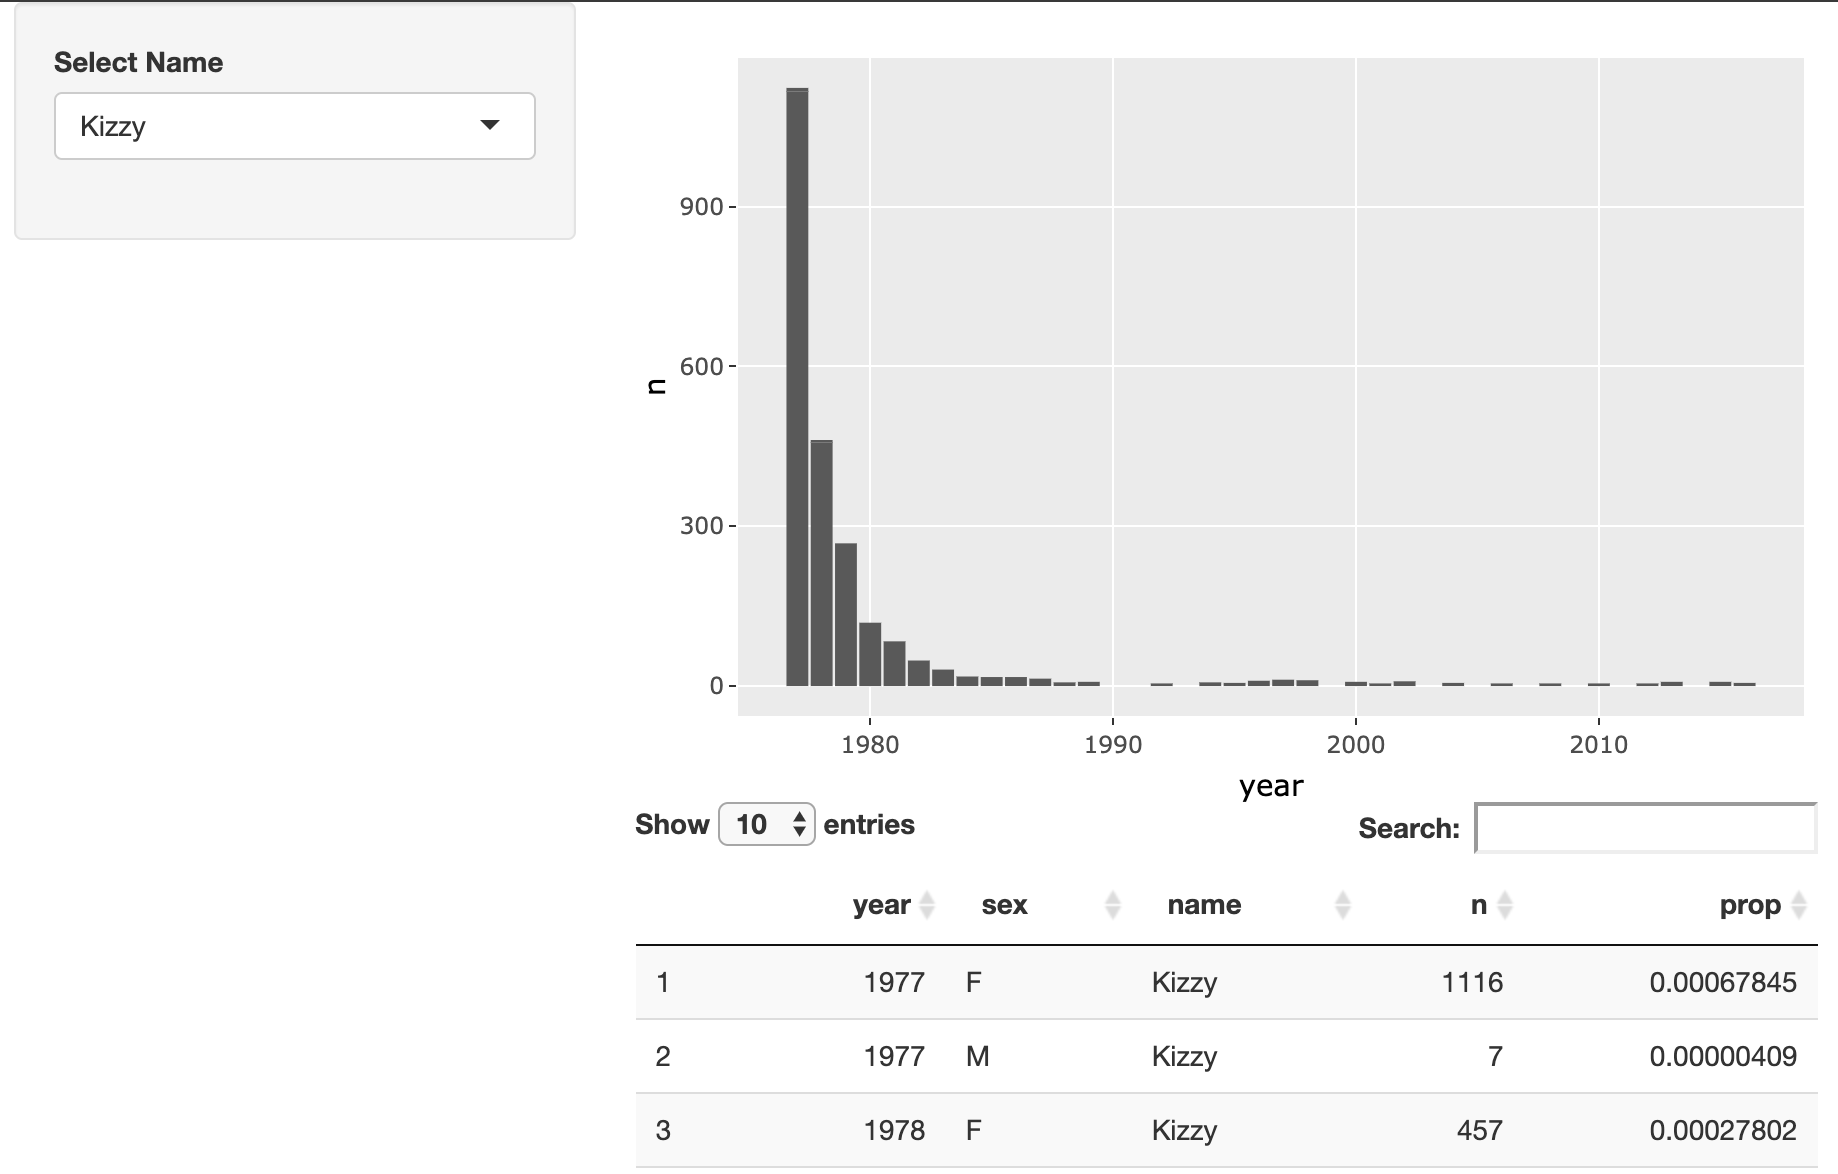
In this exercise, you will modify the layout of a Shiny app that lets users explore the popularity of trendy names. Your final app should visually resemble this:
แบบฝึกหัดนี้เป็นส่วนหนึ่งของหลักสูตร
Building Web Applications with Shiny in R
คำแนะนำการฝึกหัด
- Modify the layout of this app so that the name selector appears in the sidebar and the plot and table appear on the right.
แบบฝึกหัดเชิงโต้ตอบแบบลงมือทำ
ลองทำแบบฝึกหัดนี้โดยเติมโค้ดตัวอย่างนี้ให้สมบูรณ์
ui <- fluidPage(
  # MODIFY CODE BELOW: Wrap in a sidebarLayout
    # MODIFY CODE BELOW: Wrap in a sidebarPanel
    selectInput('name', 'Select Name', top_trendy_names$name),
    # MODIFY CODE BELOW: Wrap in a mainPanel
    plotly::plotlyOutput('plot_trendy_names'),
    DT::DTOutput('table_trendy_names')
)

# DO NOT MODIFY
server <- function(input, output, session){
  # Function to plot trends in a name
  plot_trends <- function(){
     babynames %>%
      filter(name == input$name) %>%
      ggplot(aes(x = year, y = n)) +
      geom_col()
  }
  output$plot_trendy_names <- plotly::renderPlotly({
    plot_trends()
  })

  output$table_trendy_names <- DT::renderDT({
    babynames %>%
      filter(name == input$name)
  })
}

shinyApp(ui = ui, server = server)