การตั้งค่าสี
นอกจากการตั้งค่า status ที่ใช้สีเป็นรหัสแล้ว ยังสามารถกำหนดสีเพิ่มเติมให้กับออบเจกต์อย่าง valueBox() และ infoBox() ได้อีกด้วย
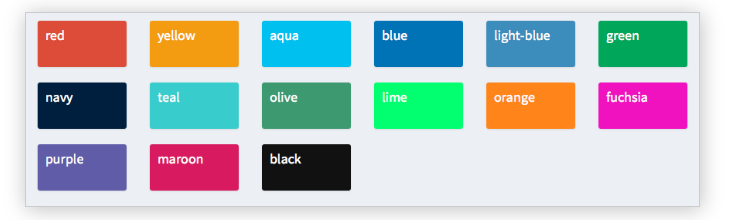
ในแบบฝึกหัดต่อไปนี้ จะได้ตั้งค่าสีต่าง ๆ ในส่วน body ของ shinydashboard แม้ว่าออบเจกต์เหล่านี้จะสามารถกำหนดใน server() ได้เช่นกัน ดังที่เห็นในตัวอย่างก่อนหน้า
ในแบบฝึกหัดนี้ ไลบรารี shiny และ shinydashboard ถูกโหลดไว้ให้แล้ว นอกจากนี้ header และ sidebar ถูกเก็บไว้ในตัวแปร header และ sidebar ตามลำดับ และ server() เป็นฟังก์ชันว่างเปล่า
แบบฝึกหัดนี้เป็นส่วนหนึ่งของหลักสูตร
การสร้างแดชบอร์ดด้วย shinydashboard
แบบฝึกหัดเชิงโต้ตอบแบบลงมือทำ
ลองทำแบบฝึกหัดนี้โดยเติมโค้ดตัวอย่างนี้ให้สมบูรณ์
library(shiny)
library(shinydashboard)

header <- dashboardHeader(
  title = "Portfolio dashboard for Sally",
  titleWidth = 300,
  dropdownMenu(type = "notifications",
       notificationItem("Sell alert", status = "danger"),
       notificationItem("Buy alert", status = "success"))
)

sidebar <- dashboardSidebar(
  width = 300,
  sidebarMenu(
    id = "pages",
    menuItem("Historical trends",
             tabName = "historical"),
    menuItem("Profits and Losses (PnLs)",
             tabName = "profit",
             icon = icon("money-bill-alt"),
             badgeLabel = "+2.3%", badgeColor = "green")
  )
)

body <- dashboardBody(tabItems(
  tabItem(tabName = "historical",
          fluidRow(box(selectInput("stock", "Select stock symbol",
                                   choices=c("AAPL", "DIS"))),
                   box("Stock name",
                       title="Stock name title",
                       width = 6,
                       status = "info", solidHeader = TRUE)),
          # Set the color of each infoBox to black
          fluidRow(infoBox("Open", "value", width = 2, color = ___),
                   infoBox("High", "value", width = 2,___),
                   infoBox("Low", "value", width = 2, ___),
                   infoBox("Close", "value", width = 2, ___),
                   # Set the color of the last infoBox to navy and set its width to 4
                   infoBox("Volume", "value", ___)),
          fluidRow(valueBox("Open (%)", "0%", width = 2),
                   valueBox("High (%)", "+1%", width = 2),
                   valueBox("Low (%)", "-4%", width = 2),
                   valueBox("Close (%)", "-2%", width = 2),
                   valueBox("Volume (%)", "+30%", width = 2)),
          fluidRow(box("Candlestick chart", width = 12, height = 350)),
          fluidRow(box("Volume chart", width = 12, height = 200))),
  tabItem(tabName = "profit",
          fluidRow(box("valueBox", "Account balance", width = 3),
                   box("valueBox",  "Value at Risk (Var)", width = 3),
                   box("valueBox", "Returns", width = 3),
                   box("valueBox", "Profit-to-loss ratio", width = 3)),
          fluidRow(box("PnL chart", width = 12, height = 400)))
)
)

ui <- dashboardPage(header, sidebar, body)
server <- function(input, output){}
shinyApp(ui, server)