Interpreting histograms
Here is a histogram of sales of office supplies orders. Each row of the dataset represents an order, so each order has one sale value.
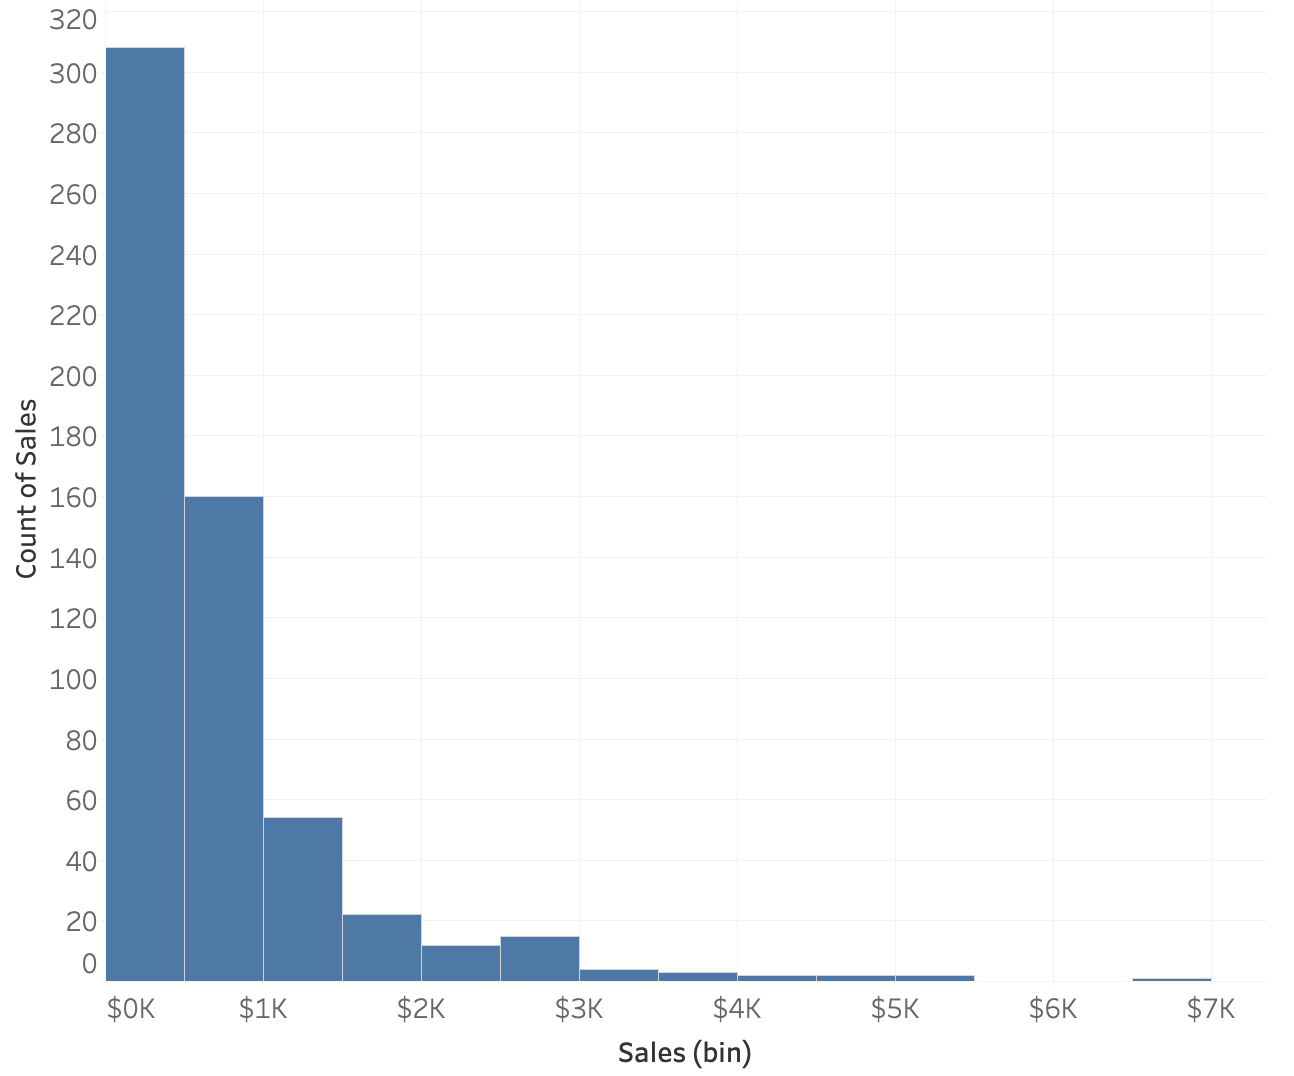
Tip: This left-hand pane of the exercise containing text and instructions is resizable. If the plot is too small to see clearly, you can drag to make it bigger.
Это упражнение является частью курса
Статистические методы в Tableau
Практическое интерактивное упражнение
Превратите теорию в практику с помощью одного из наших интерактивных упражнений
 Начать упражнение