Анализ эффективности кампаний
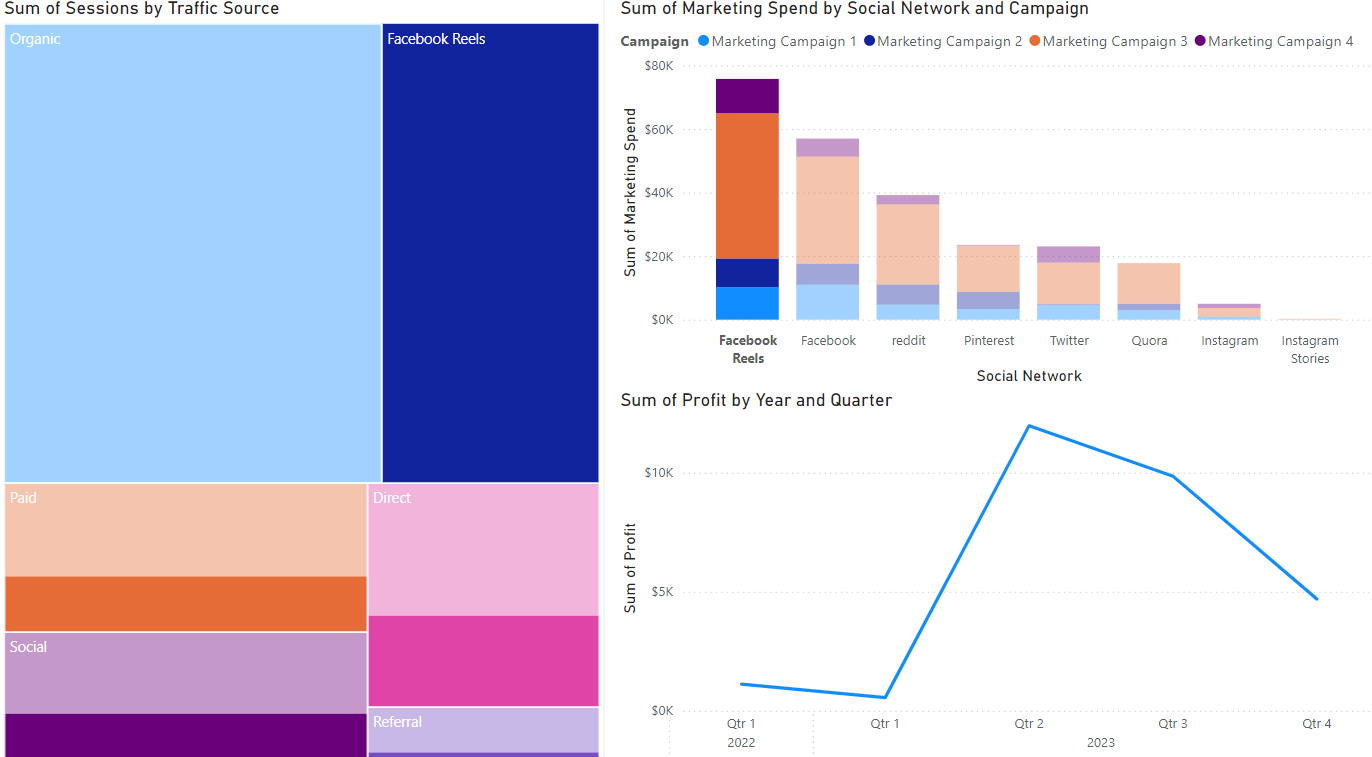
Время анализировать кампании! Предположим, вы создали древовидную карту (сеансы по источнику трафика), гистограмму (расходы на маркетинг по каналам) и линейный график (прибыль). Вид вкладки отчёта по умолчанию показан ниже.
Используем эти визуализации Power BI, чтобы выявить наиболее прибыльную кампанию и найти возможности для оптимизации.
Это упражнение является частью курса
Power BI для конечных пользователей
Практическое интерактивное упражнение
Превратите теорию в практику с помощью одного из наших интерактивных упражнений
 Начать упражнение