Interpreting time series plots
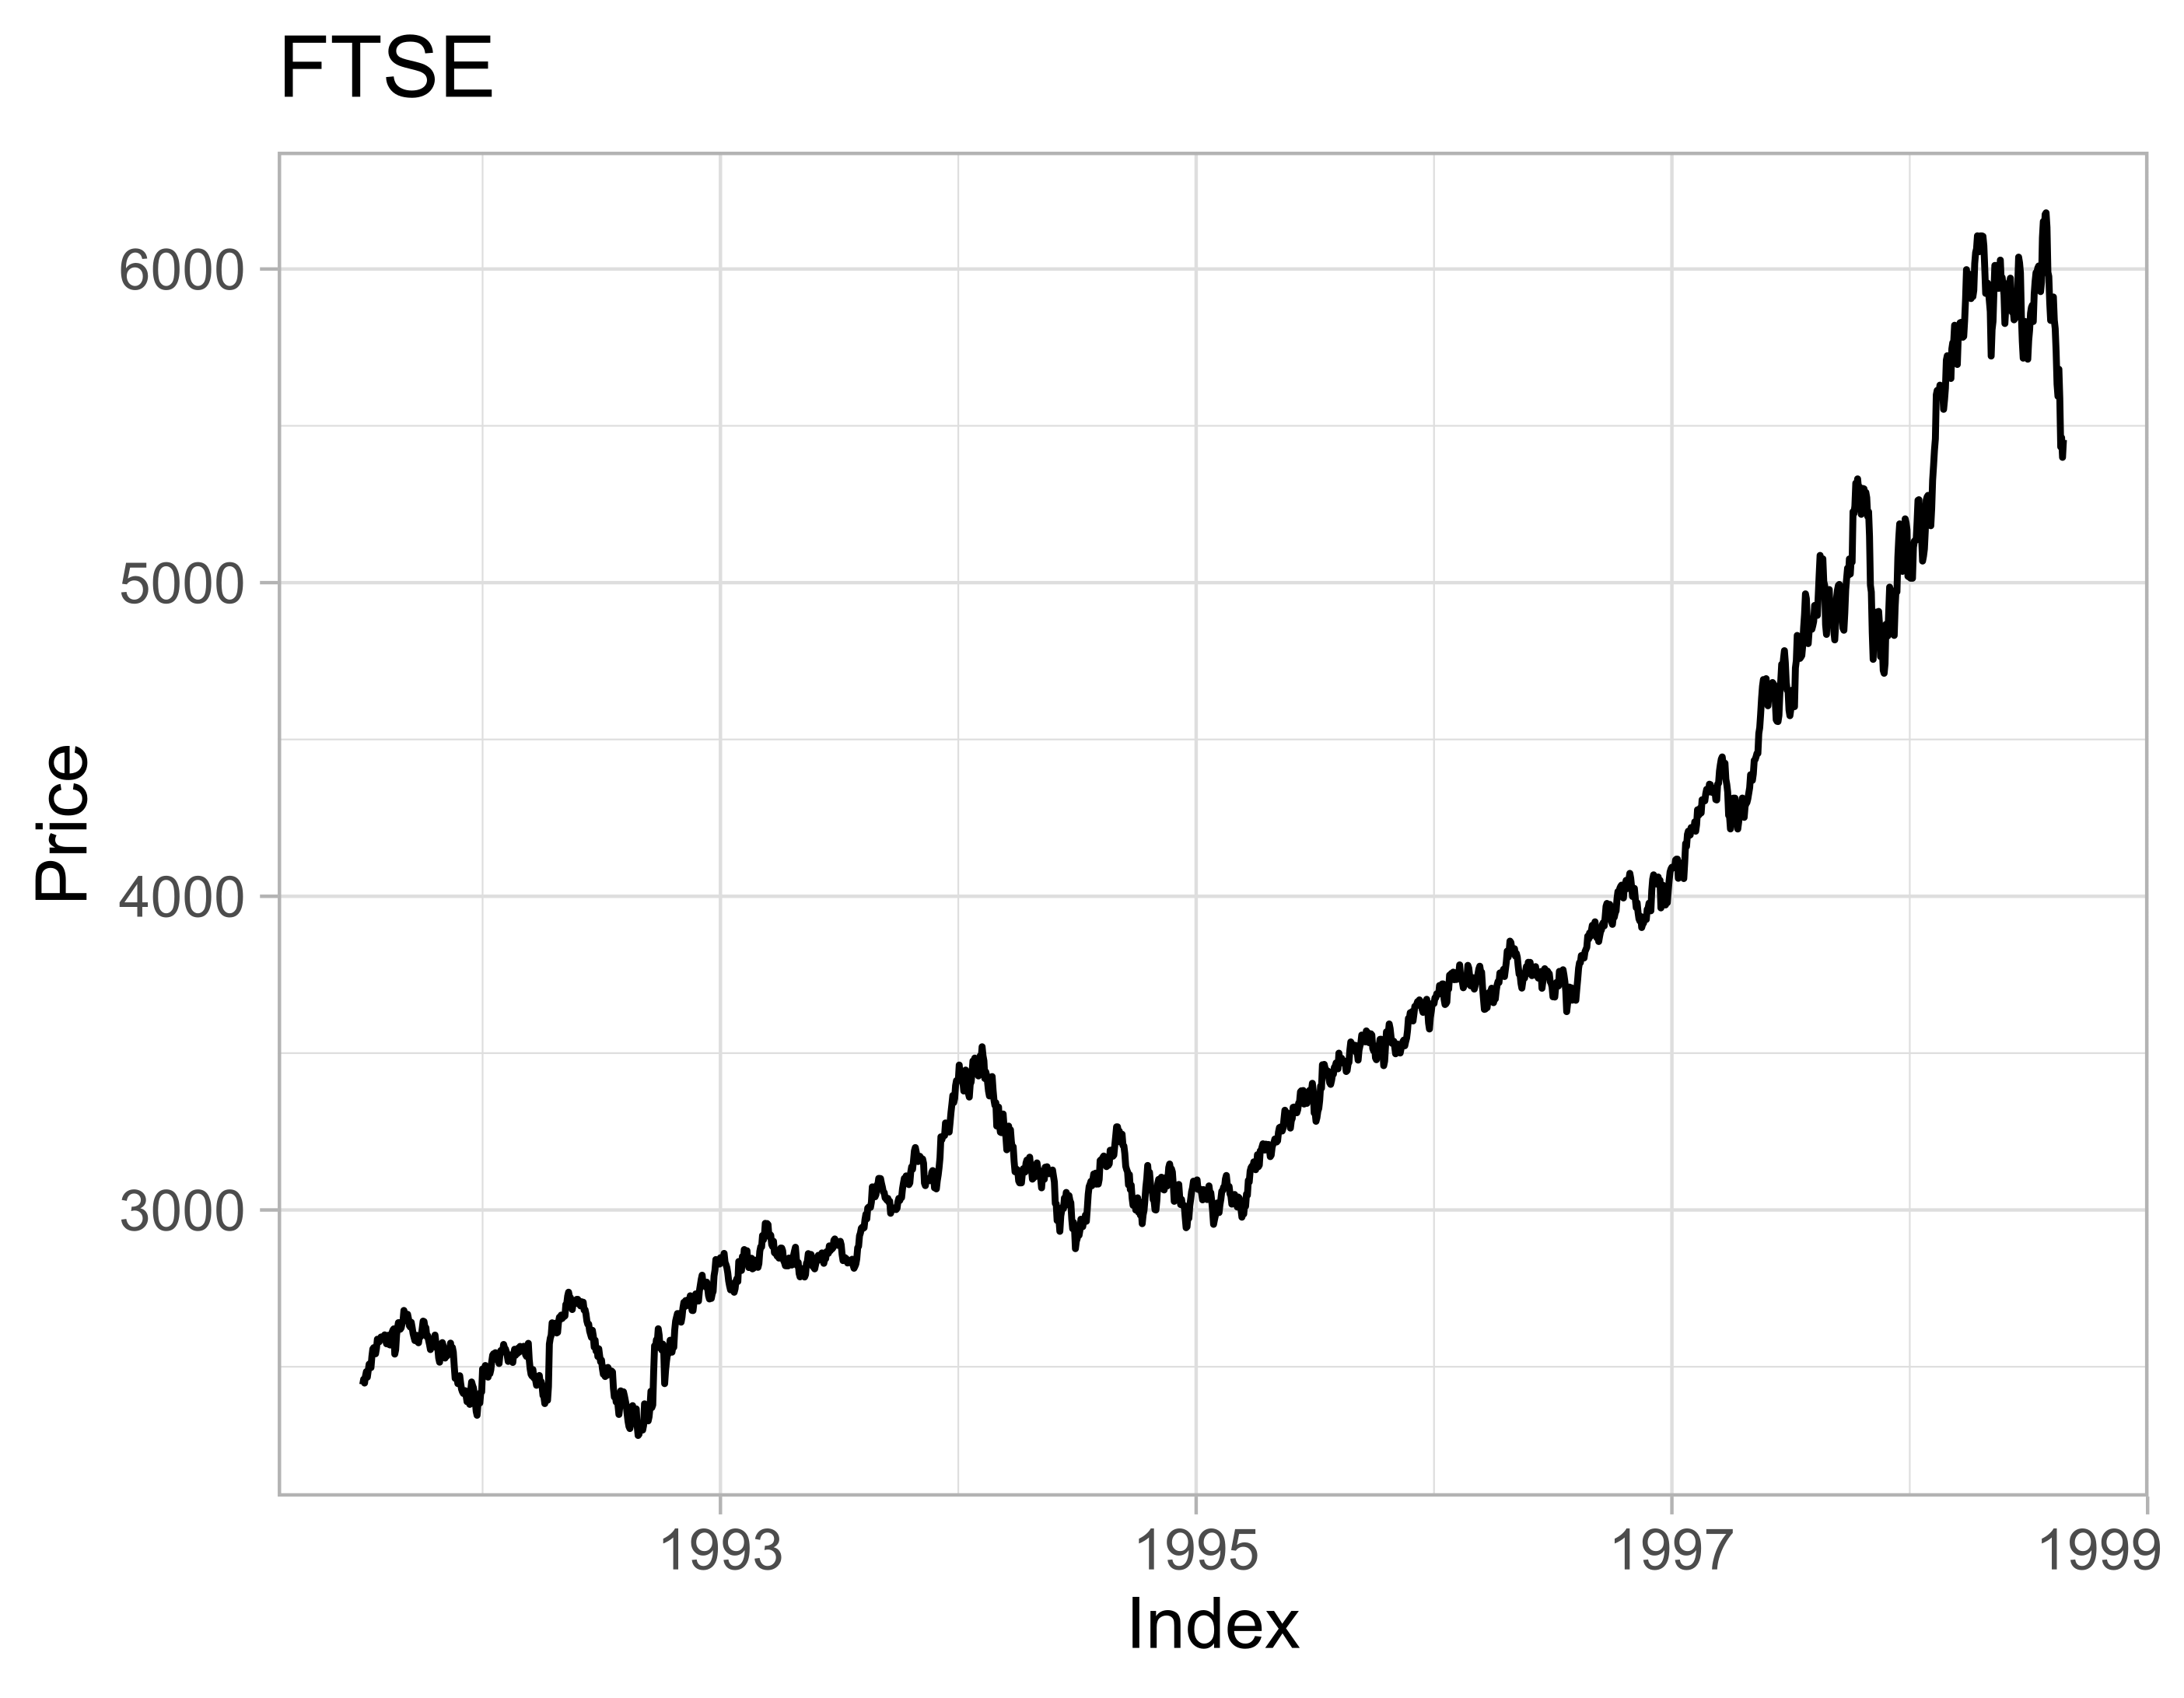
When visualizing time series data, it is vital to be able to interpret the different features and attributes of the plots of your data. Determining the properties of your data from a plot allows you to better prepare the tools needed in your analysis. In this exercise, you'll interpret some of the properties of the ftse time series, based on its plot.
Это упражнение является частью курса
Manipulating Time Series Data in R
Практическое интерактивное упражнение
Превратите теорию в практику с помощью одного из наших интерактивных упражнений
 Начать упражнение