Validating the clusters
In the plot below you see the clustering results of the same lineup data you've previously worked with but with some minor modifications in the clustering steps.
- The left plot was generated using a
k=2andmethod = 'average' - The right plot was generated using a
k=3andmethod = 'complete'
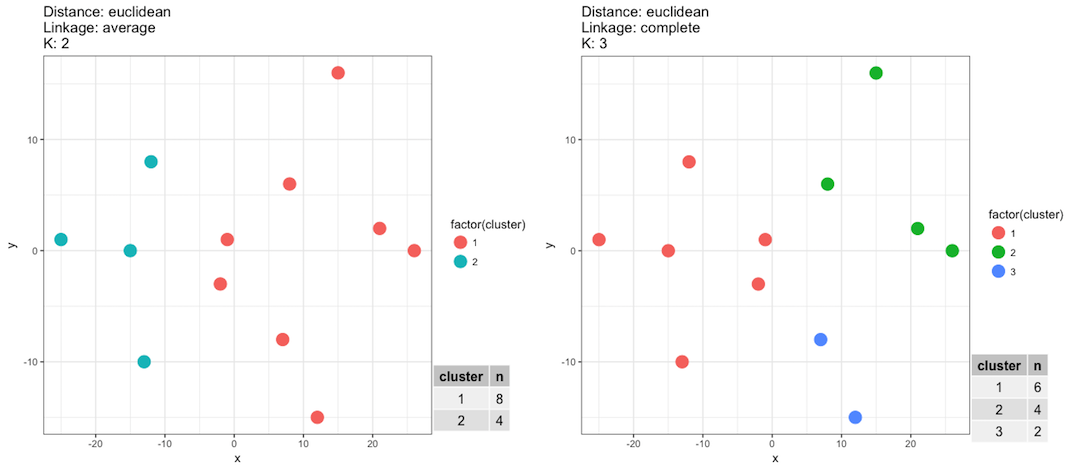
If our goal is to correctly assign each player to their correct team then based on what you see in the above plot and what you know about the data set which of the statements below are correct?
Это упражнение является частью курса
Cluster Analysis in R
Практическое интерактивное упражнение
Превратите теорию в практику с помощью одного из наших интерактивных упражнений
 Начать упражнение