Bombas nucleares por país
Você recebeu uma versão do Nuclear Explosion DataBase (NEDB) em que os nomes dos países estão nos nomes das colunas (nuke_df). Você quer visualizar quantas ogivas foram detonadas por ano em cada país. Para isso, será preciso fazer um pivot dos dados e substituir os valores NA primeiro.
O pacote ggplot2 já foi carregado para você.
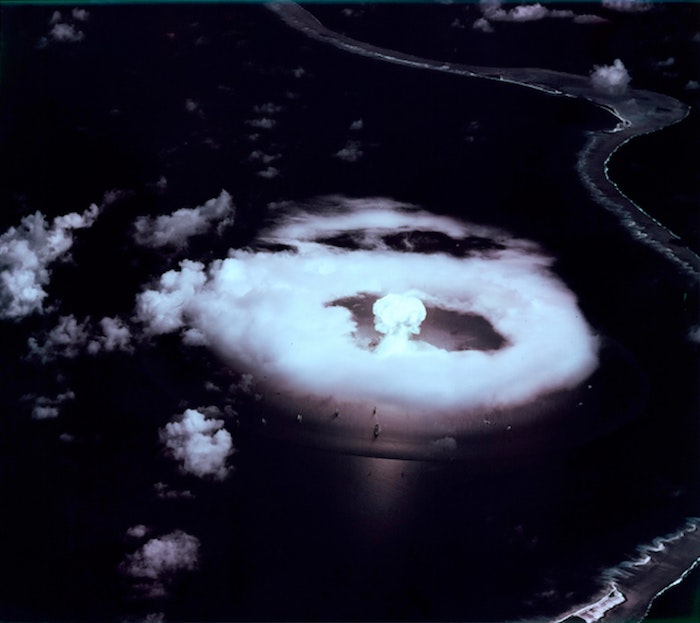
"A-Day" Primeira explosão de bomba atômica em Bikini, nas Ilhas Marshall, 1º de julho de 1946.
Este exercicio faz parte do curso
Reestruturando dados com tidyr
exercicio interativo prático
Tente este exercicio completando este código de exemplo.
nuke_df %>%
  # Pivot the data to a longer format
  ___