Planning queries with an E:R diagram
An E:R diagram visually shows all tables, fields, and relationships in a database. You are given the following E:R diagram:
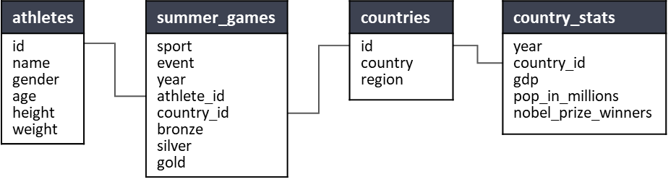
You are tasked with building a report that shows Age of Oldest Athlete by Region. What tables will need to be included in the query?
Deze oefening maakt deel uit van de cursus
Reporting in SQL
Interactieve oefening met praktijkervaring
Zet theorie om in actie met een van onze interactieve oefeningen
 Begin oefening