Minder is soms meer
Soms is minder meer als het gaat om data storytelling.
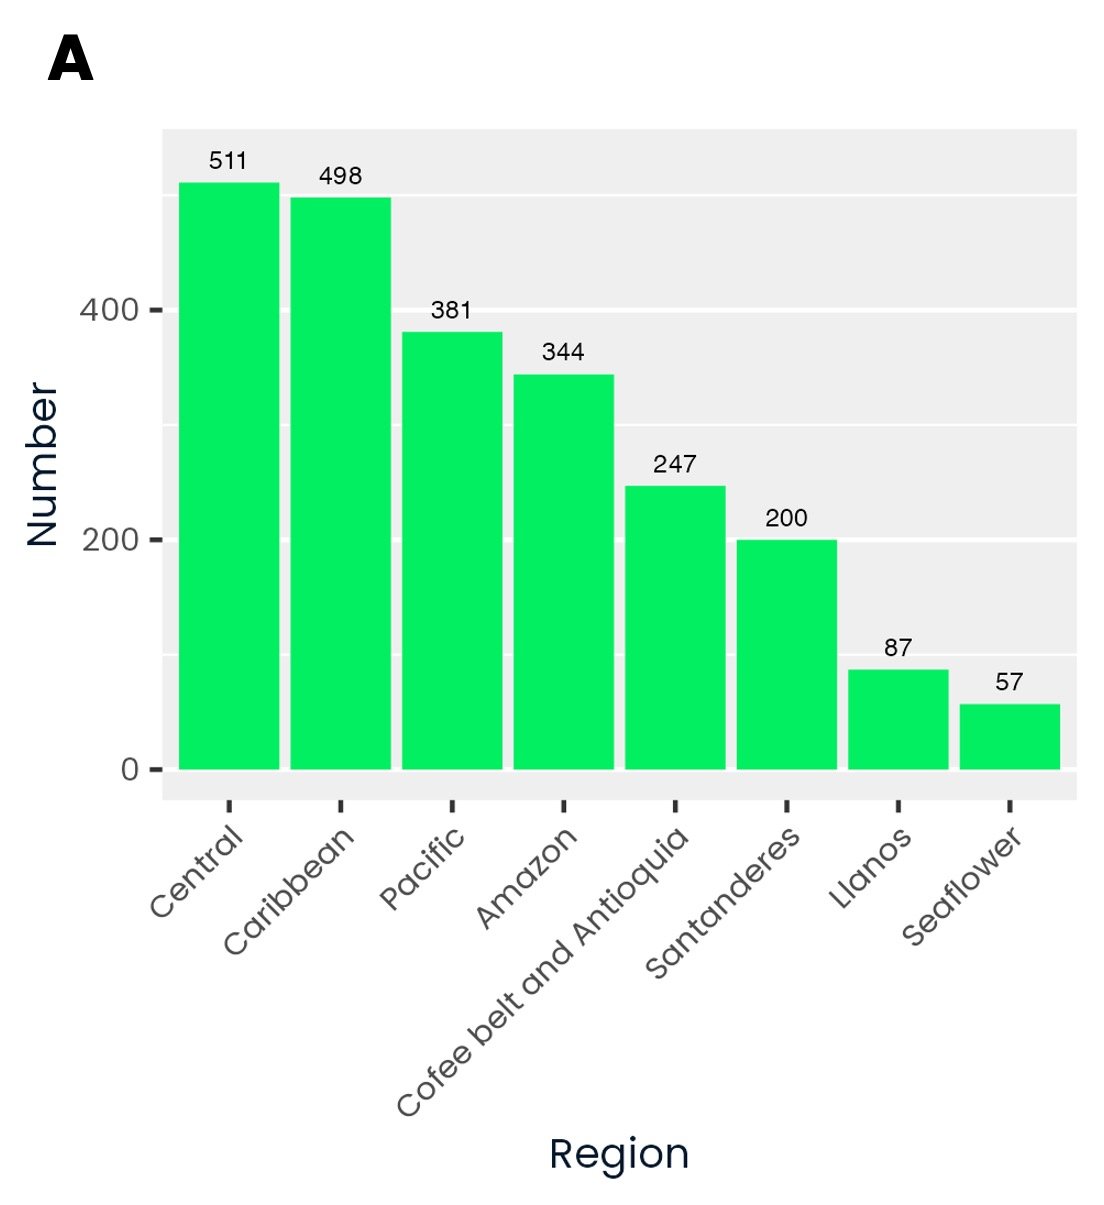
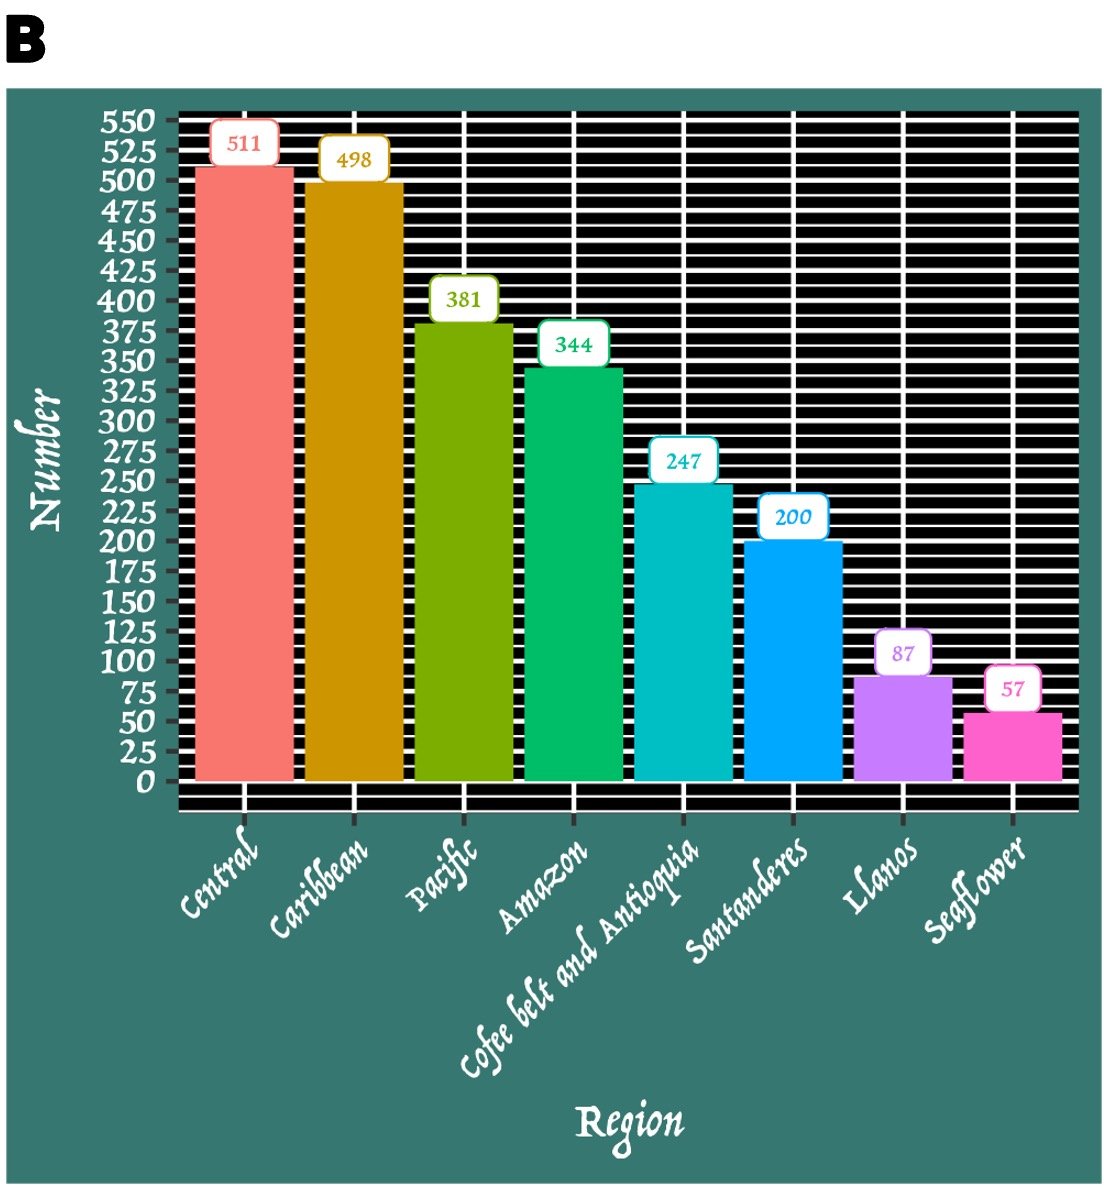
Te veel informatie kan het voor je publiek lastig maken om het verhaal te begrijpen. In de volgende oefeningen bekijken we een aantal goede praktijken voor het maken van grafieken.
Kijk nu naar deze grafieken en kies de ONJUISTE optie uit de onderstaande keuzes.
Deze oefening maakt deel uit van de cursus
Data Storytelling Casestudy: Groene bedrijven
Interactieve oefening met praktijkervaring
Zet theorie om in actie met een van onze interactieve oefeningen
 Begin oefening