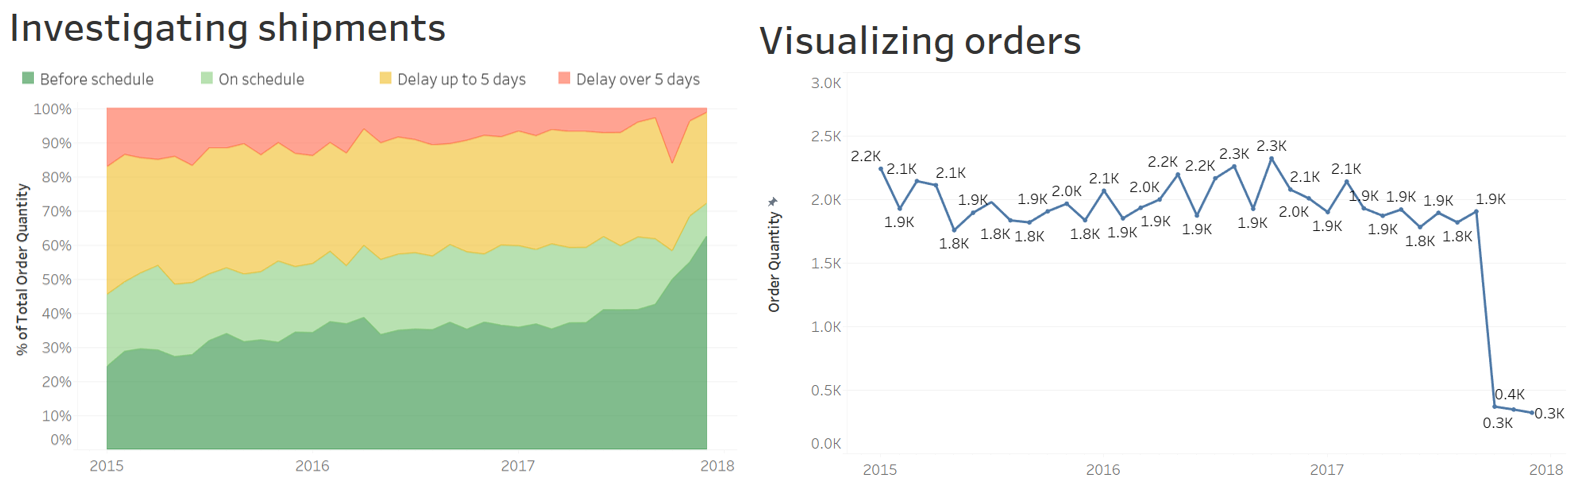
Conclusies trekken uit de grafieken
Welke zin(nen) vatten deze twee visualisaties correct samen?
Deze oefening maakt deel uit van de cursus
Casestudy: Supply Chain-analytics in Tableau
Interactieve oefening met praktijkervaring
Zet theorie om in actie met een van onze interactieve oefeningen
 Begin oefening