Hoeveel home runs?
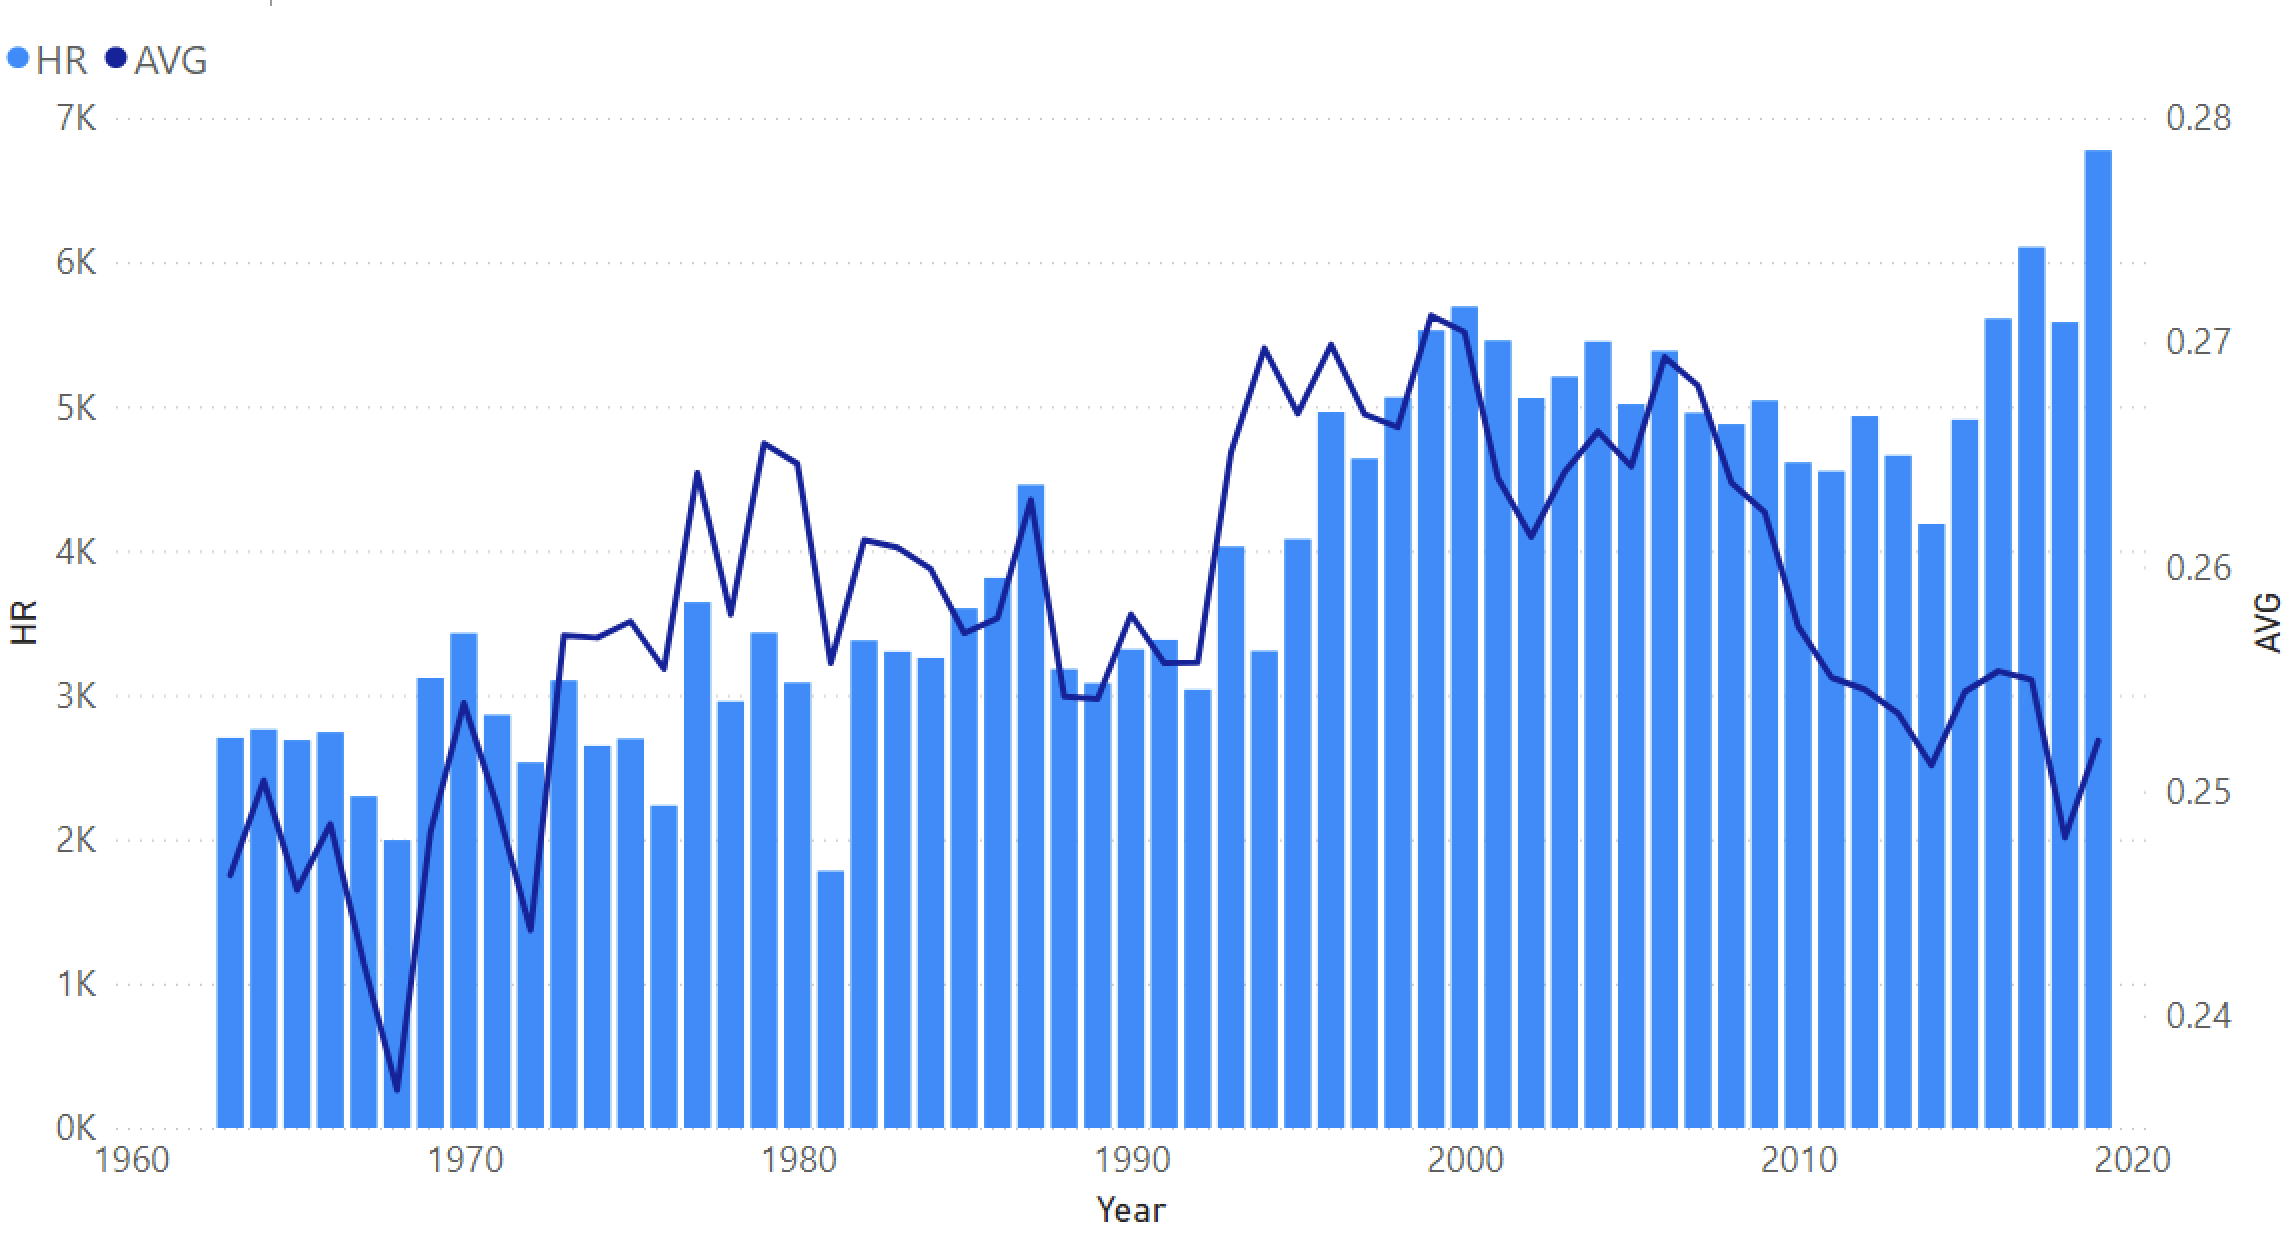 Kijkend naar de gecombineerde lijn- en gegroepeerde kolomgrafiek die je in de vorige oefening hebt gemaakt: welk jaar tussen 1963 en 2019 had het laagste aantal home runs (HR)?
Deze oefening maakt deel uit van de cursus
Baseball-gegevens visualiseren in Power BI
Interactieve oefening met praktijkervaring
Zet theorie om in actie met een van onze interactieve oefeningen
 Begin oefening