Interpreting dendrogram
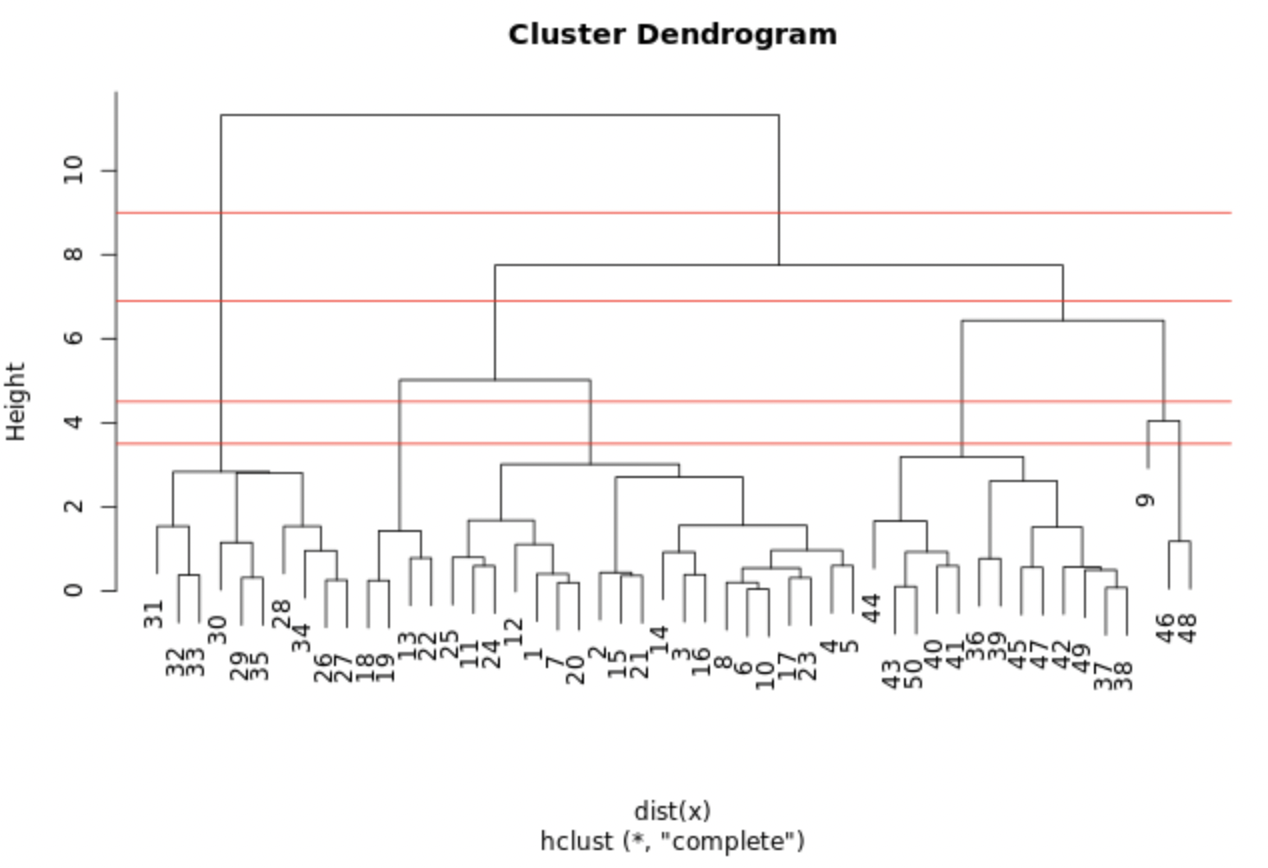
The plot displayed shows the hclust.out model you constructed in the previous exercise. We've drawn horizontal lines at heights of 3.5, 4.5, 6.9, and 9.0, respectively.
Which cut point yields 3 clusters?
이 연습은 강의의 일부입니다
The plot displayed shows the hclust.out model you constructed in the previous exercise. We've drawn horizontal lines at heights of 3.5, 4.5, 6.9, and 9.0, respectively.
Which cut point yields 3 clusters?
이 연습은 강의의 일부입니다
