Anomalous techniques
As we've seen in the videos, there exist multiple ways to identify anomalous values.
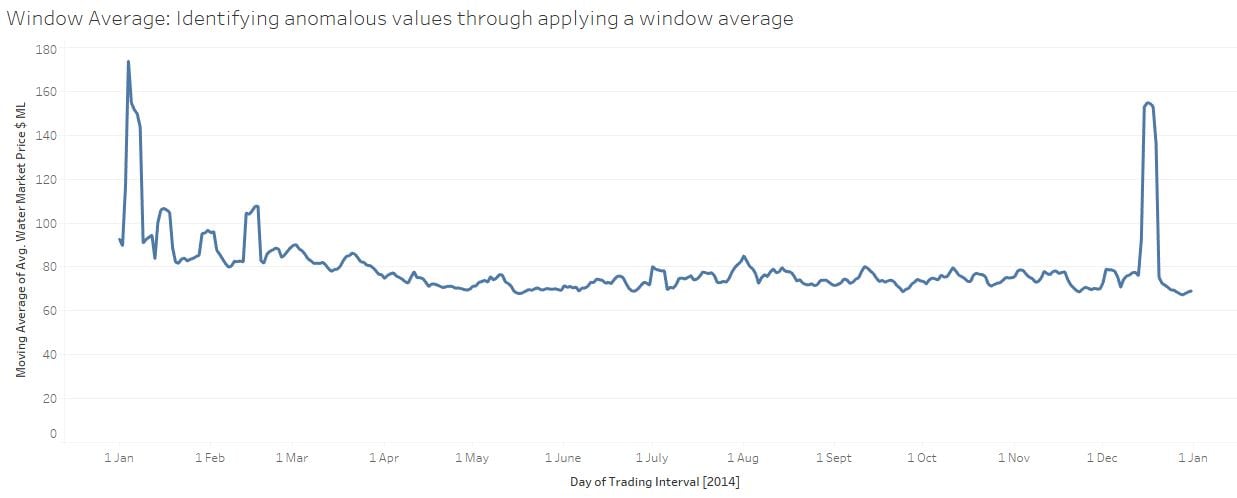
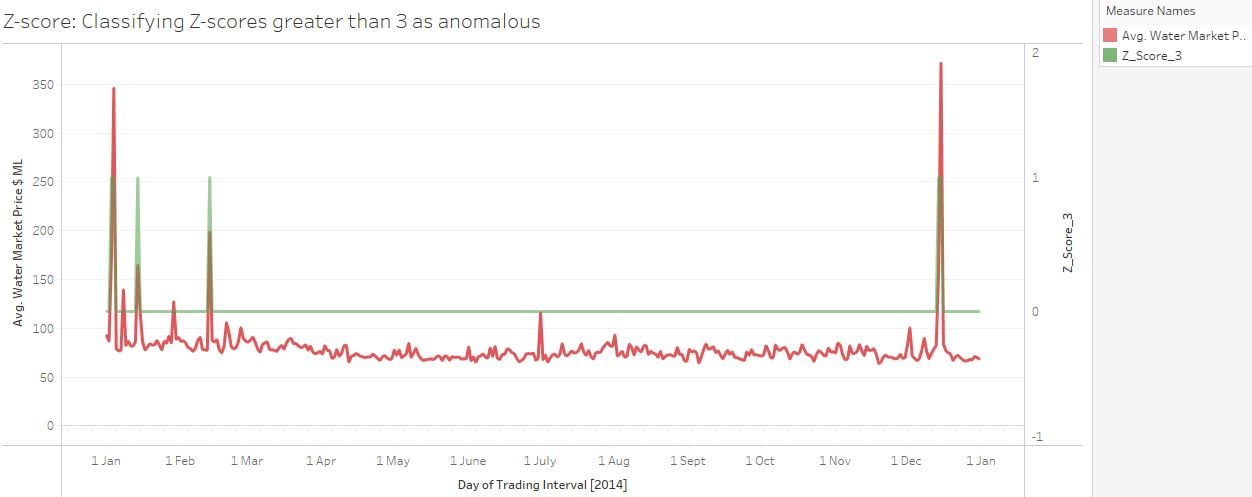
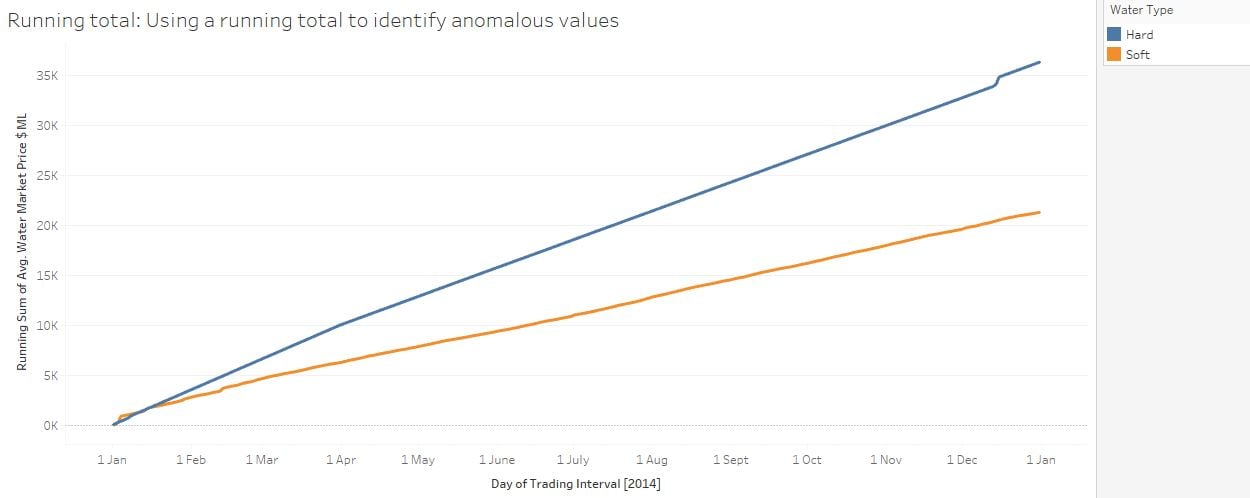
We've created a series of visualizations that may highlight anomaly identification techniques.
Which of the below is not a valid technique to identify anomalous values?
Take a look at the below visuals!
Questo esercizio fa parte del corso
Time Series Analysis in Tableau
esercizio interattivo pratico
Trasforma la teoria in pratica con uno dei nostri esercizi interattivi
 Inizia esercizio