Interpretare gli istogrammi
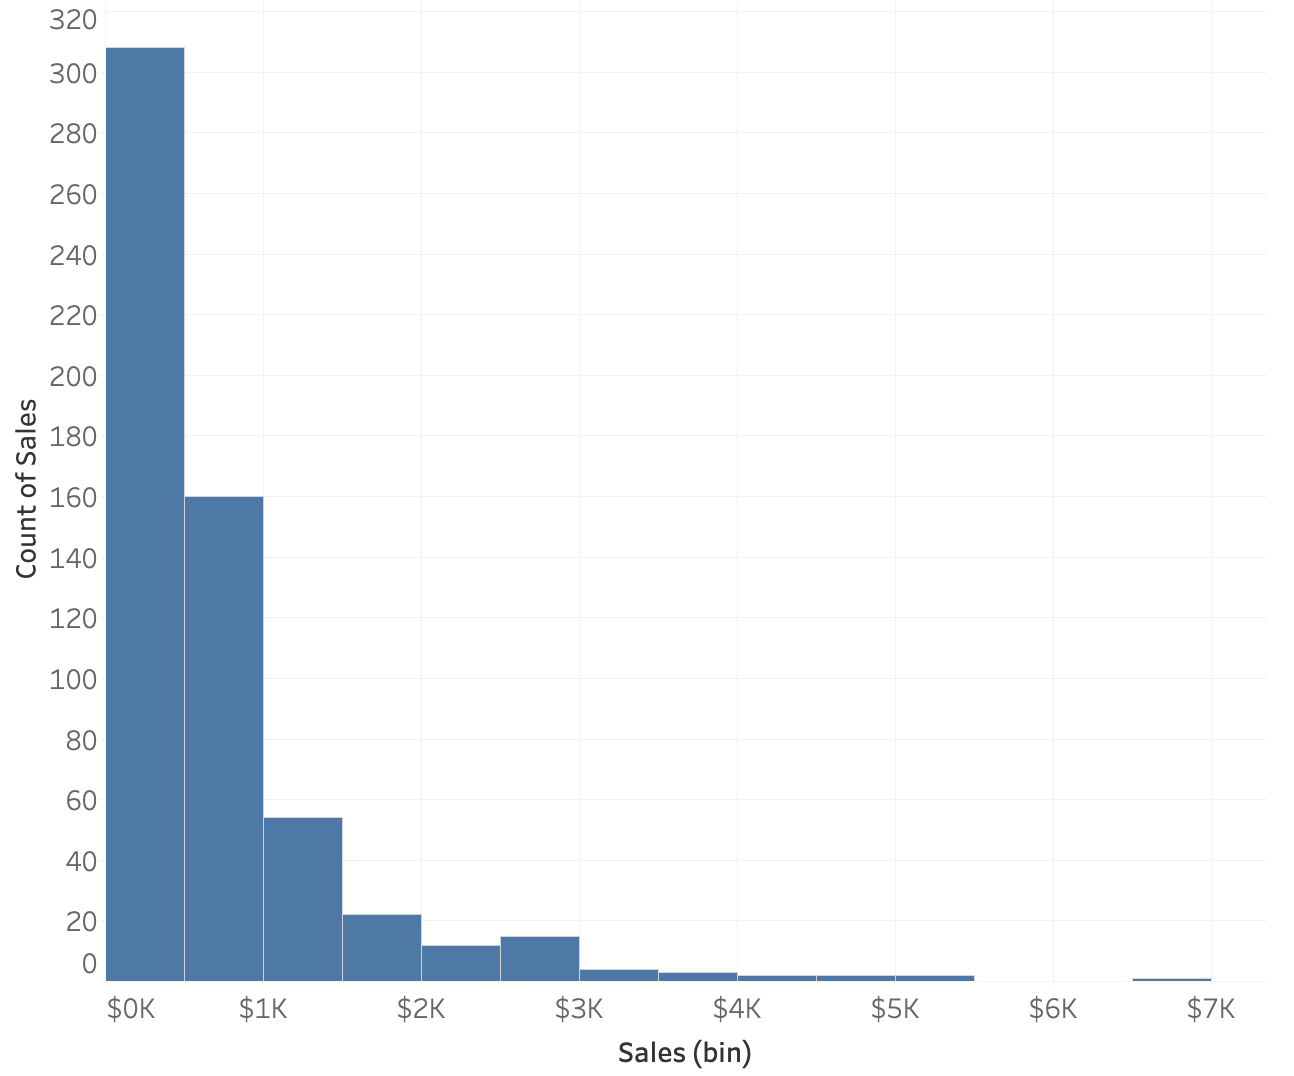
Ecco un istogramma delle vendite degli ordini di forniture per ufficio. Ogni riga dell'insieme di dati rappresenta un ordine, quindi ogni ordine ha un valore di vendita.
Suggerimento: Questo riquadro a sinistra con testo e istruzioni è ridimensionabile. Se il grafico è troppo piccolo per vederlo bene, trascina per ingrandirlo.
Questo esercizio fa parte del corso
Tecniche statistiche in Tableau
esercizio interattivo pratico
Trasforma la teoria in pratica con uno dei nostri esercizi interattivi
 Inizia esercizio