Svelare le performance delle campagne
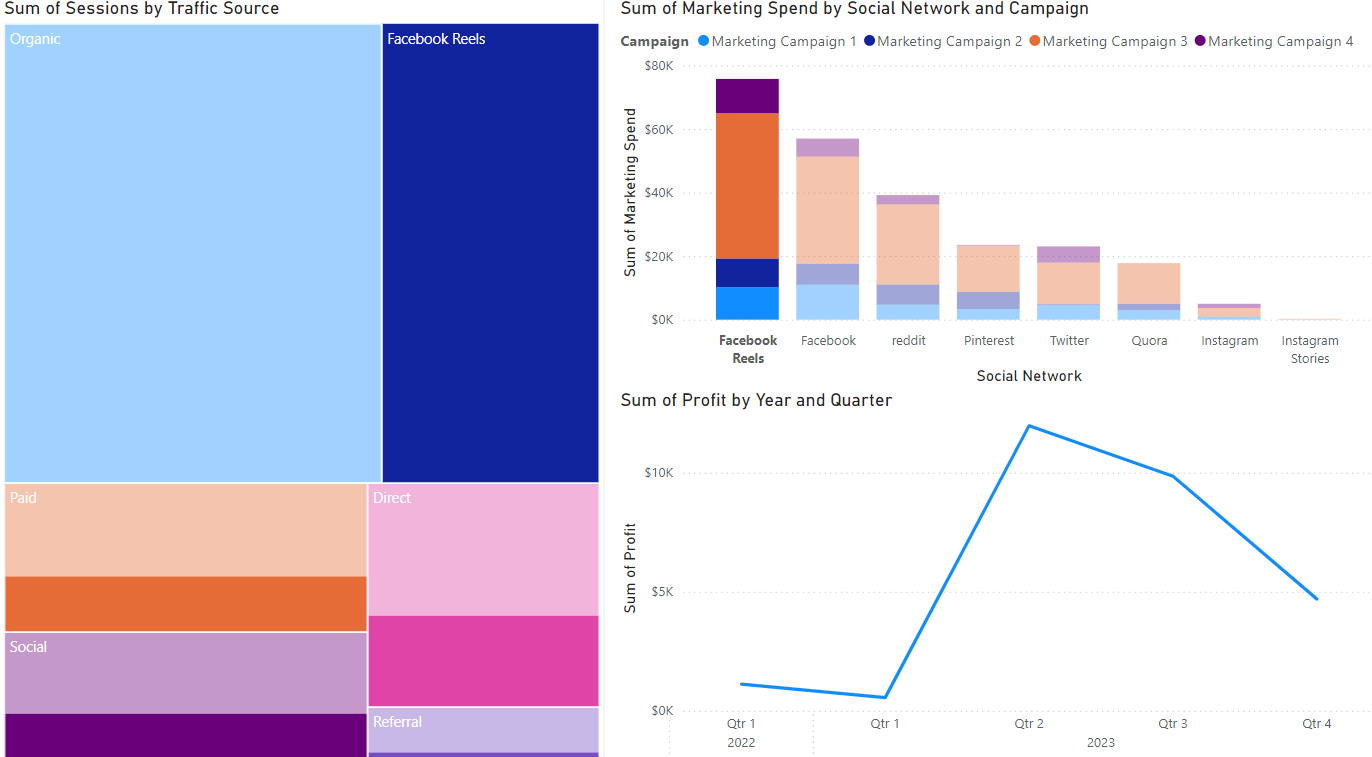
È il momento dell’analisi delle campagne! Diciamo che hai creato un tree map (sessioni per fonte di traffico), un grafico a barre (spesa marketing per canale) e un grafico a linee (profitto). La vista predefinita della scheda del tuo report è mostrata qui sotto.
Usiamo queste visualizzazioni di Power BI per analizzare la campagna più redditizia e individuare opportunità di ottimizzazione.
Questo esercizio fa parte del corso
Power BI per utenti finali
esercizio interattivo pratico
Trasforma la teoria in pratica con uno dei nostri esercizi interattivi
 Inizia esercizio