Eyeballing the mean IQ of zombies?
In the last exercise, you computed the probability for each mean (mu) and SD (sigma) combination. Using the levelplot function from the lattice package we can now visualize this 2D probability distribution:
levelplot(probability ~ mu * sigma, data = pars)
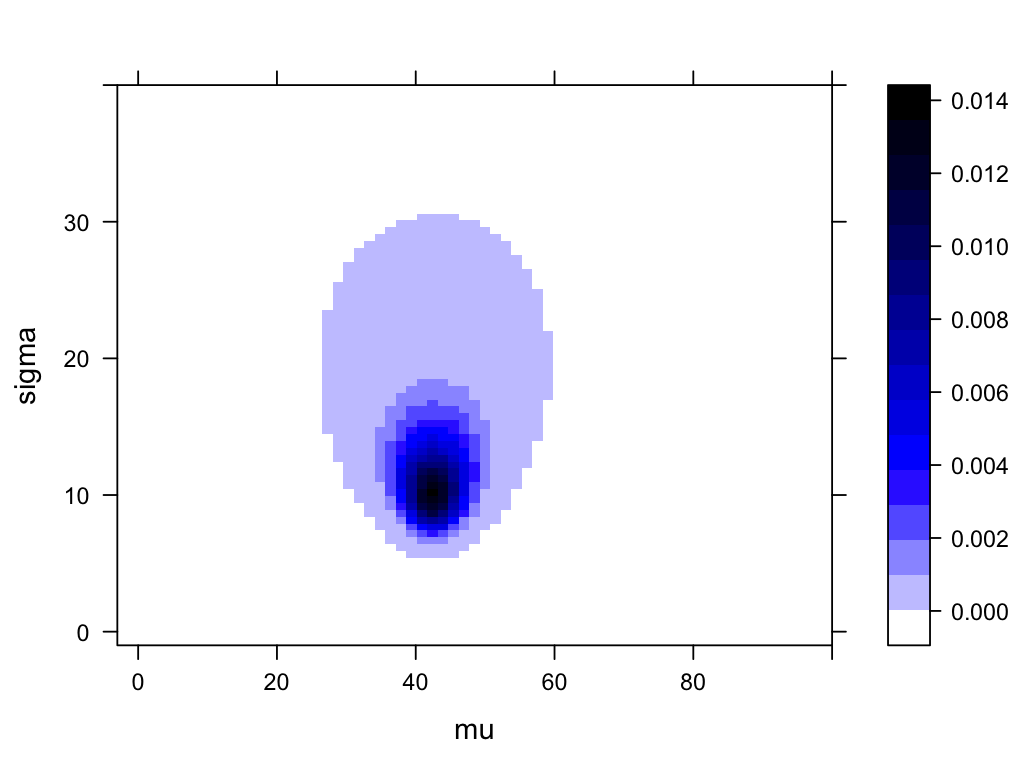
We could calculate all kinds of credible intervals and probabilities from this plot, but just eyeballing it:
- What is the most probable mean (
mu) of the IQ of Zombies? Roughly how uncertain is the estimate ofmu?
Questo esercizio fa parte del corso
Fundamentals of Bayesian Data Analysis in R
esercizio interattivo pratico
Trasforma la teoria in pratica con uno dei nostri esercizi interattivi
 Inizia esercizio