Notizie fuorvianti?
Buonasera, ecco l'aggiornamento quotidiano. Oggi ti riportiamo un dato preoccupante: l'aumento dei posti di lavoro persi, che sta lasciando molte persone e famiglie in una situazione di incertezza. Diamo un'occhiata più da vicino ai dati..
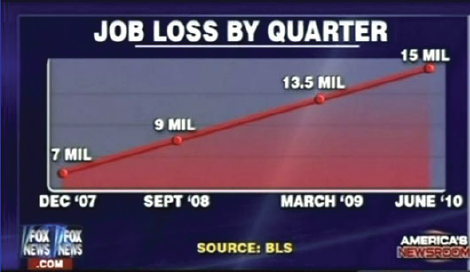
Source: https://www.businessinsider.com/the-27-worst-charts-of-all-time-2013-6
Come aspirante esperto di visualizzazione dei dati, di certo puoi individuare diversi problemi in questo grafico. Oltre a evidenti imperfezioni di formattazione, il grafico è altamente ingannevole.
Riesci a identificare i motivi per cui è fuorviante?
Questo esercizio fa parte del corso
Visualizzazione dei dati in Excel
esercizio interattivo pratico
Trasforma la teoria in pratica con uno dei nostri esercizi interattivi
 Inizia esercizio