Quanti home run?
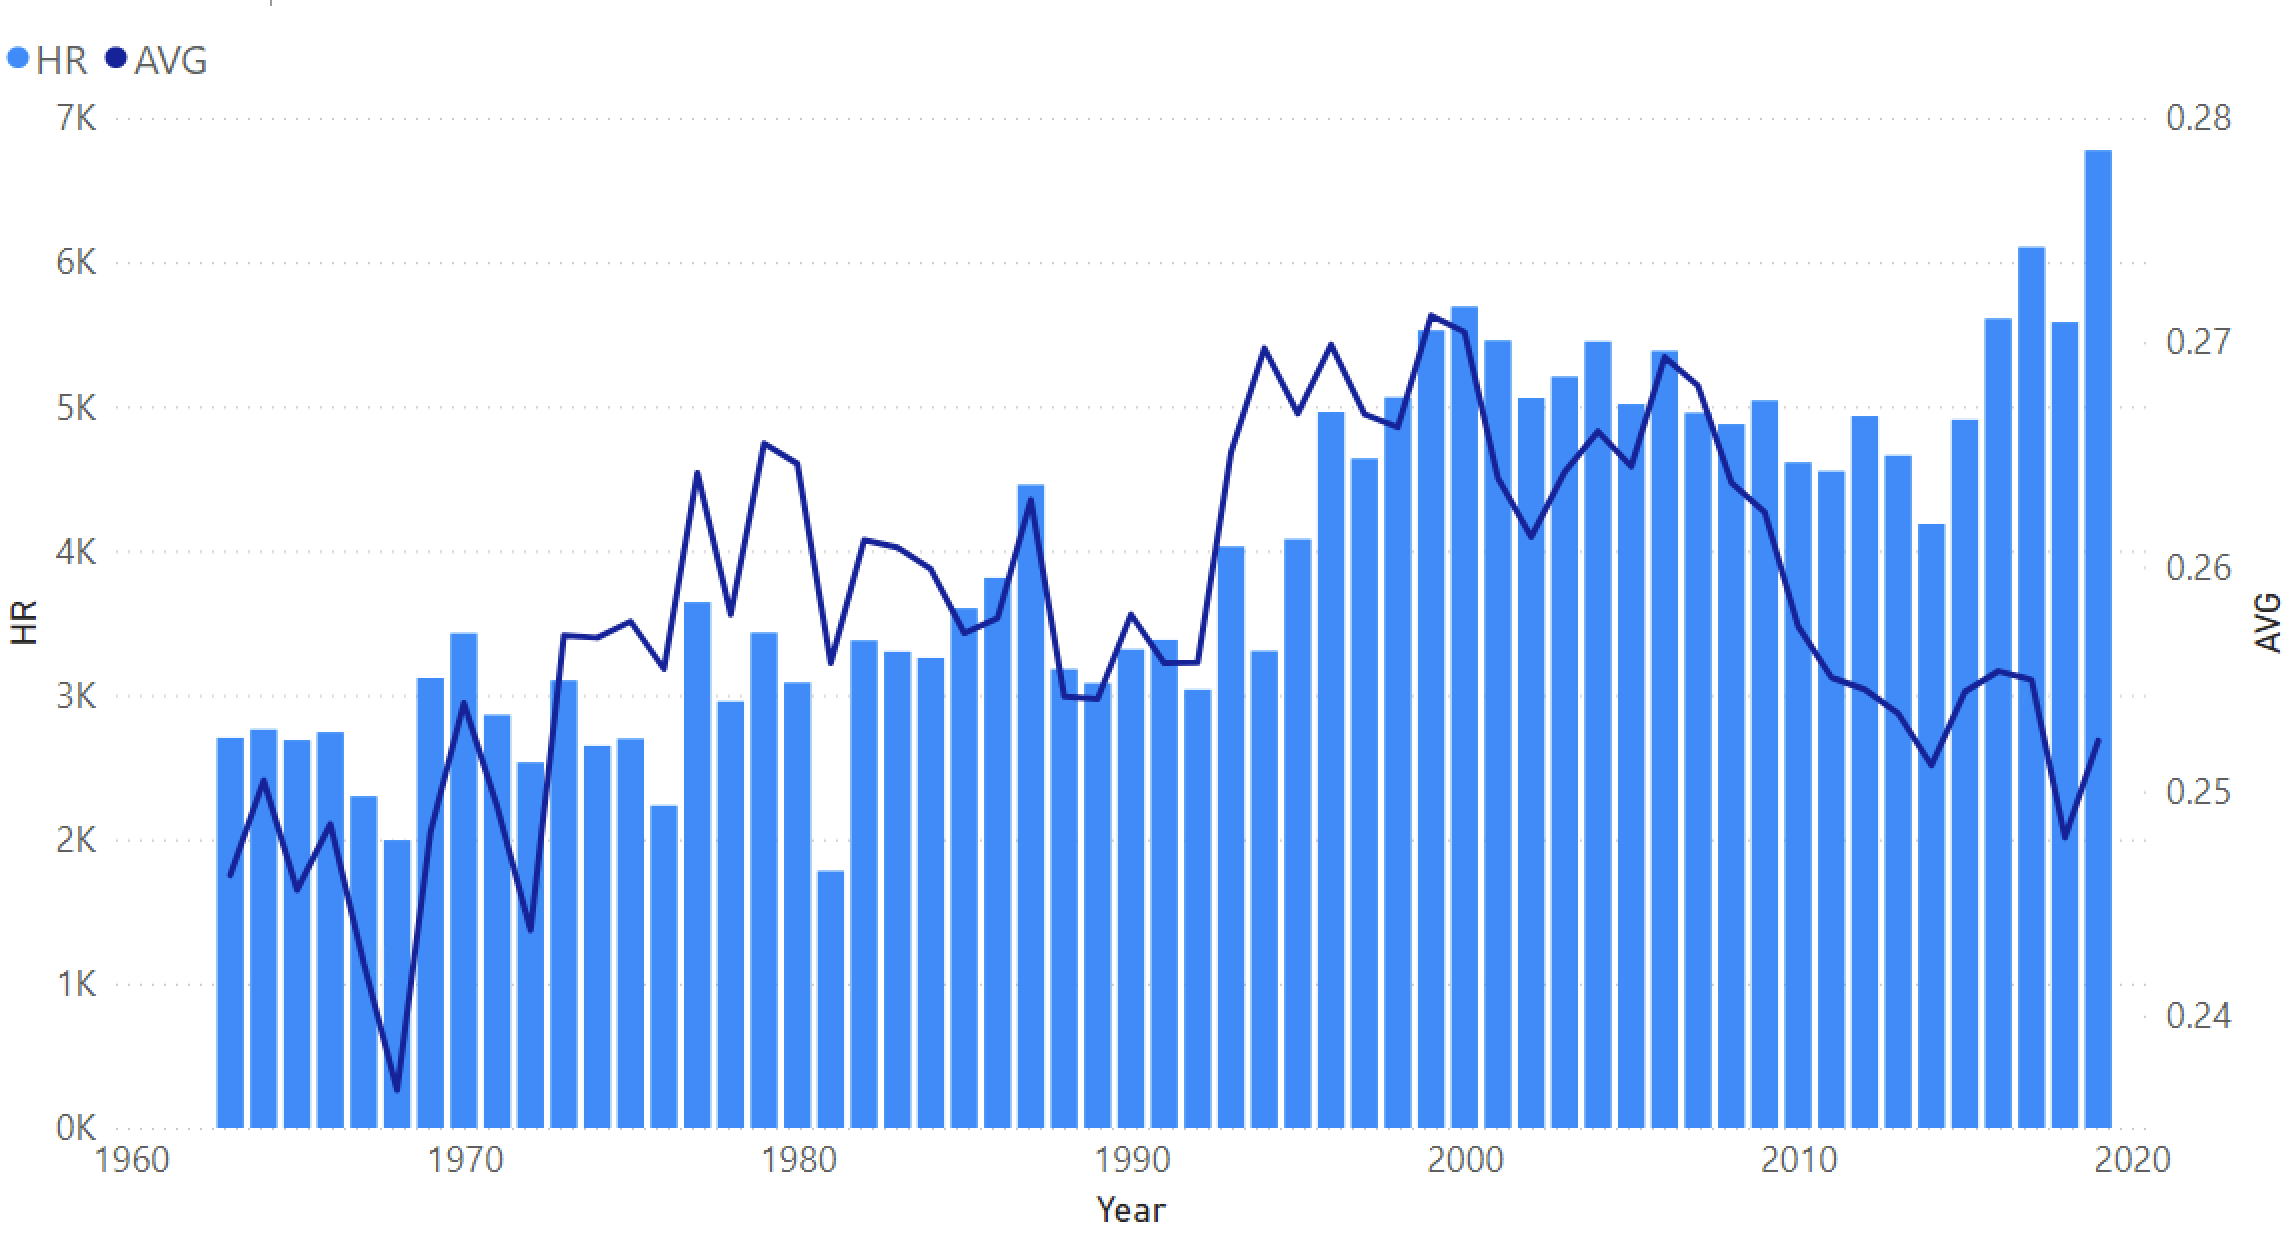 Considerando il grafico a linee e colonne in cluster che hai creato nell’esercizio precedente, quale anno, tra il 1963 e il 2019, ha registrato il minor numero di home run (HR)?
Questo esercizio fa parte del corso
Visualizzazione dei dati del baseball in Power BI
esercizio interattivo pratico
Trasforma la teoria in pratica con uno dei nostri esercizi interattivi
 Inizia esercizio